Textbook Question
Let and . Find each of the following. See Examples 2 –4.
(3/2)B
2
views


 Verified step by step guidance
 06:07
06:07 3:21
3:21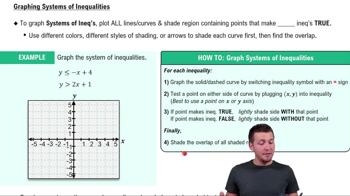 6:19
6:19Let and . Find each of the following. See Examples 2 –4.
(3/2)B
Let and . Find each of the following. See Examples 2 –4.
2A + 4B
Let and . Find each of the following.
-A + (1/2)B
Graph the solution set of each system of inequalities.
4x - 3y ≤ 12
y ≤ x2
Determine the system of equations illustrated in each graph. Write equations in standard form.
Solve each equation.