Ch. 4 - Inverse, Exponential, and Logarithmic Functions
Lial - College Algebra 13th Edition
Lial13th EditionCollege AlgebraISBN: 9780136881063Not the one you use?Change textbook
Chapter 5, Problem 43

Match the function with its graph from choices A–F. ƒ(x) = log2 x

Verified step by step guidance
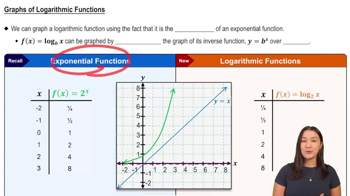
1
Recognize that the function given is a logarithmic function with base 2, written as \(f(x) = \log_{2} x\).
Recall the general shape of the graph of \(f(x) = \log_{a} x\) where \(a > 1\): it passes through the point \((1,0)\) because \(\log_{a} 1 = 0\), and it increases slowly, approaching negative infinity as \(x\) approaches 0 from the right.
Identify the domain of the function, which is \(x > 0\), meaning the graph exists only to the right of the y-axis and never touches or crosses the y-axis (the y-axis is a vertical asymptote).
Note that the function is increasing because the base 2 is greater than 1, so the graph rises as \(x\) increases.
Use these characteristics to match the function \(f(x) = \log_{2} x\) with the correct graph among choices A–F: look for a curve that passes through \((1,0)\), is defined only for positive \(x\), increases slowly, and has a vertical asymptote at \(x=0\).

Verified video answer for a similar problem:

This video solution was recommended by our tutors as helpful for the problem above.
Video duration:
2m
Was this helpful?

Key Concepts

Here are the essential concepts you must grasp in order to answer the question correctly.

Logarithmic Functions

A logarithmic function is the inverse of an exponential function and is written as f(x) = log_b(x), where b is the base. It answers the question: to what power must the base b be raised to get x? Understanding its properties, such as domain (x > 0) and range (all real numbers), is essential for graph matching.
Recommended video:
5:26
Graphs of Logarithmic Functions

Graph Characteristics of Logarithmic Functions

The graph of f(x) = log_b(x) passes through (1,0) because log_b(1) = 0, has a vertical asymptote at x = 0, and increases slowly for x > 1 if b > 1. Recognizing these features helps distinguish logarithmic graphs from other function types.
Recommended video:
5:26
Graphs of Logarithmic Functions

Base of the Logarithm and Its Effect on the Graph

The base b in log_b(x) affects the shape and direction of the graph. For b > 1, the graph increases and is concave downward; for 0 < b < 1, it decreases. Since the base here is 2, the graph will be increasing, which is key to matching the correct graph.
Recommended video:
5:26
Graphs of Logarithmic Functions