Ch. 3 - Polynomial and Rational Functions
Lial - College Algebra 13th Edition
Lial13th EditionCollege AlgebraISBN: 9780136881063Not the one you use?Change textbook
Chapter 4, Problem 24

Use an end behavior diagram, as shown below, to describe the end behavior of the graph of each polynomial function. ƒ(x)=4x7-x5+x3-1

Verified step by step guidance
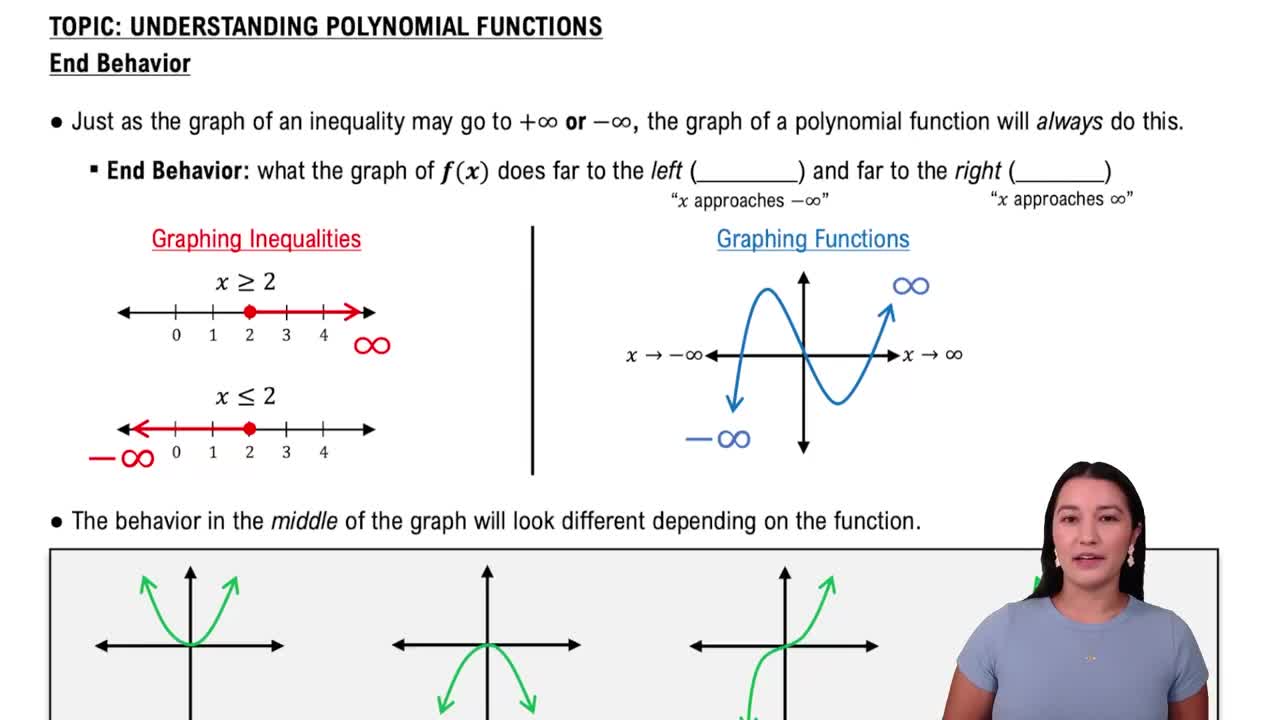
1
Identify the leading term of the polynomial function. For the function \(f(x) = 4x^7 - x^5 + x^3 - 1\), the leading term is \$4x^7\( because it has the highest power of \)x$.
Determine the degree and the leading coefficient of the polynomial. Here, the degree is 7 (which is odd), and the leading coefficient is 4 (which is positive).
Recall the end behavior rules for polynomials: For an odd degree with a positive leading coefficient, as \(x \to \infty\), \(f(x) \to \infty\), and as \(x \to -\infty\), \(f(x) \to -\infty\).
Use this information to sketch or describe the end behavior diagram: the graph falls to the left (goes down as \(x\) approaches negative infinity) and rises to the right (goes up as \(x\) approaches positive infinity).
Summarize the end behavior: \(\lim_{x \to -\infty} f(x) = -\infty\) and \(\lim_{x \to \infty} f(x) = \infty\).

Verified video answer for a similar problem:

This video solution was recommended by our tutors as helpful for the problem above.
Video duration:
3m
Was this helpful?

Key Concepts

Here are the essential concepts you must grasp in order to answer the question correctly.

End Behavior of Polynomial Functions

End behavior describes how the values of a polynomial function behave as x approaches positive or negative infinity. It is determined mainly by the leading term, which dominates the function for very large or very small x-values.
Recommended video:
06:08
End Behavior of Polynomial Functions

Leading Term and Degree of a Polynomial

The leading term is the term with the highest power of x in a polynomial. The degree (highest exponent) and the coefficient of this term dictate the general shape and end behavior of the graph.
Recommended video:
Guided course
05:16
Standard Form of Polynomials

Using End Behavior Diagrams

End behavior diagrams visually represent the direction of the graph's ends as x approaches infinity or negative infinity. They help summarize whether the graph rises or falls on each side based on the leading term's degree and sign.
Recommended video:
06:08
End Behavior of Polynomial Functions