Find the coordinates of the other endpoint of each line segment, given its midpoint and one endpoint. See Example 5(b). midpoint (-9, 8), endpoint (-16, 9)
Ch. 2 - Graphs and Functions

Chapter 3, Problem 38
Use a graphing calculator to graph each equation in the standard viewing window. -2x + 5y = 10
Verified step by step guidance1
Rewrite the given equation \(-2x + 5y = 10\) in slope-intercept form \(y = mx + b\) by isolating \(y\). Start by adding \(2x\) to both sides: \(5y = 2x + 10\).
Next, divide every term by 5 to solve for \(y\): \(y = \frac{2}{5}x + 2\). This is the equation in slope-intercept form, where the slope \(m = \frac{2}{5}\) and the y-intercept \(b = 2\).
Turn on your graphing calculator and enter the equation \(y = \frac{2}{5}x + 2\) into the function input (usually labeled as \(Y=\)).
Use the standard viewing window on your calculator, which typically has \(x\) values from \(-10\) to \(10\) and \(y\) values from \(-10\) to \(10\), to graph the line.
Observe the graph to confirm that the line crosses the y-axis at \(2\) and rises with a slope of \(\frac{2}{5}\), meaning it goes up 2 units for every 5 units it moves to the right.

Verified video answer for a similar problem:
This video solution was recommended by our tutors as helpful for the problem above.
Video duration:
2mKey Concepts
Here are the essential concepts you must grasp in order to answer the question correctly.
Standard Form of a Linear Equation
The standard form of a linear equation is Ax + By = C, where A, B, and C are constants. Understanding this form helps in identifying the coefficients of x and y, which are essential for graphing the line and converting to other forms like slope-intercept.
Recommended video:
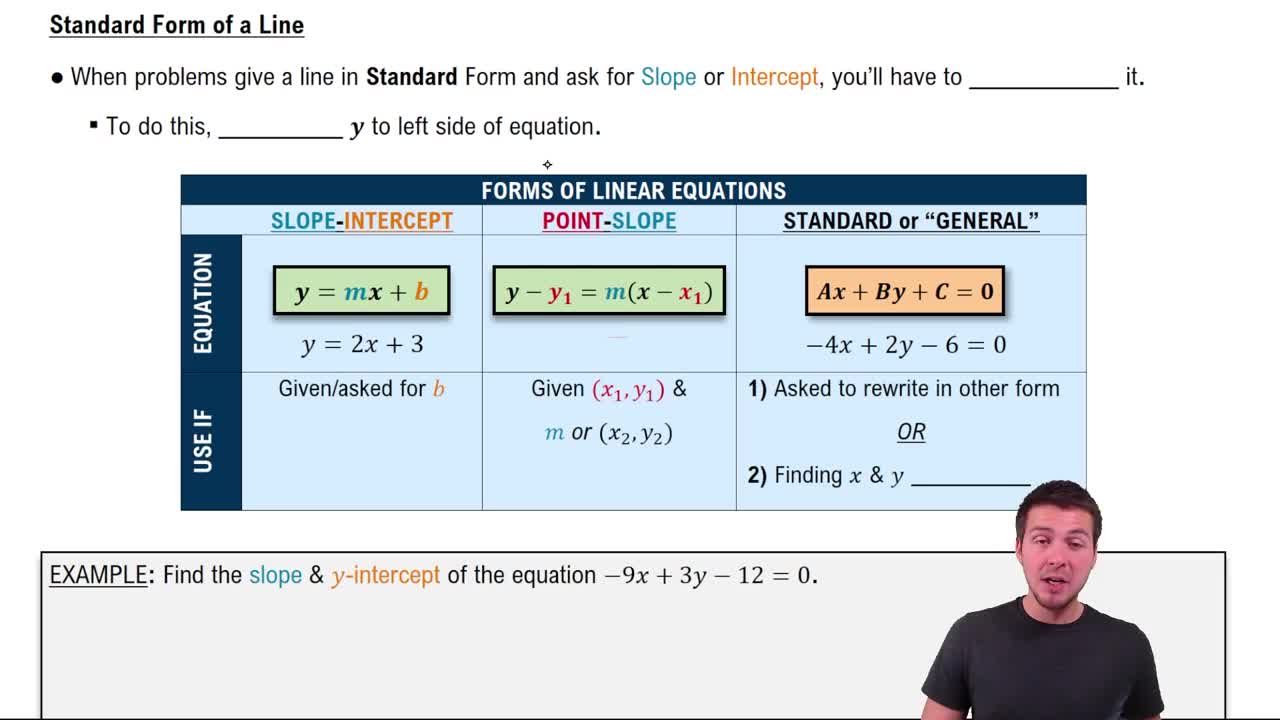
Standard Form of Line Equations
Graphing Linear Equations Using a Calculator
Graphing calculators allow you to input equations and visualize their graphs quickly. For linear equations, you often need to solve for y in terms of x or use the calculator's function input to plot the line within the standard viewing window.
Recommended video:
Categorizing Linear Equations
Standard Viewing Window
The standard viewing window on a graphing calculator typically ranges from -10 to 10 on both axes. Knowing this helps ensure the graph is displayed properly and that key points like intercepts are visible for analysis.
Recommended video:
Standard Form of Polynomials
Related Practice
Textbook Question
2
views
Textbook Question
Determine whether each relation defines y as a function of x. Give the domain and range. See Example 5. y=-6x+4
3
views
Textbook Question
Find the slope and y-intercept of each line, and graph it. 4x-y =7
Textbook Question
Describe the graph of each equation as a circle, a point, or nonexistent. If it is a circle, give the center and radius. If it is a point, give the coordinates. x2+y2+4x+4y+8=0
1
views
Textbook Question
If a walkway rises 2.5 ft for every 10 ft on the horizontal, which of the following express its slope (or grade)? <Image>
A. 0.25, B. 4, C. 2.5/10, D. 25%, E. 1/4, F. 10/2.5, G. 400%, H. 2.5%
Textbook Question
Plot each point, and then plot the points that are symmetric to the given point with respect to the (a) x-axis, (b) y-axis, and (c) origin. (5, -3)
5
views