Textbook Question
Find the value of the function for the given value of x.
1
views

 Verified step by step guidance
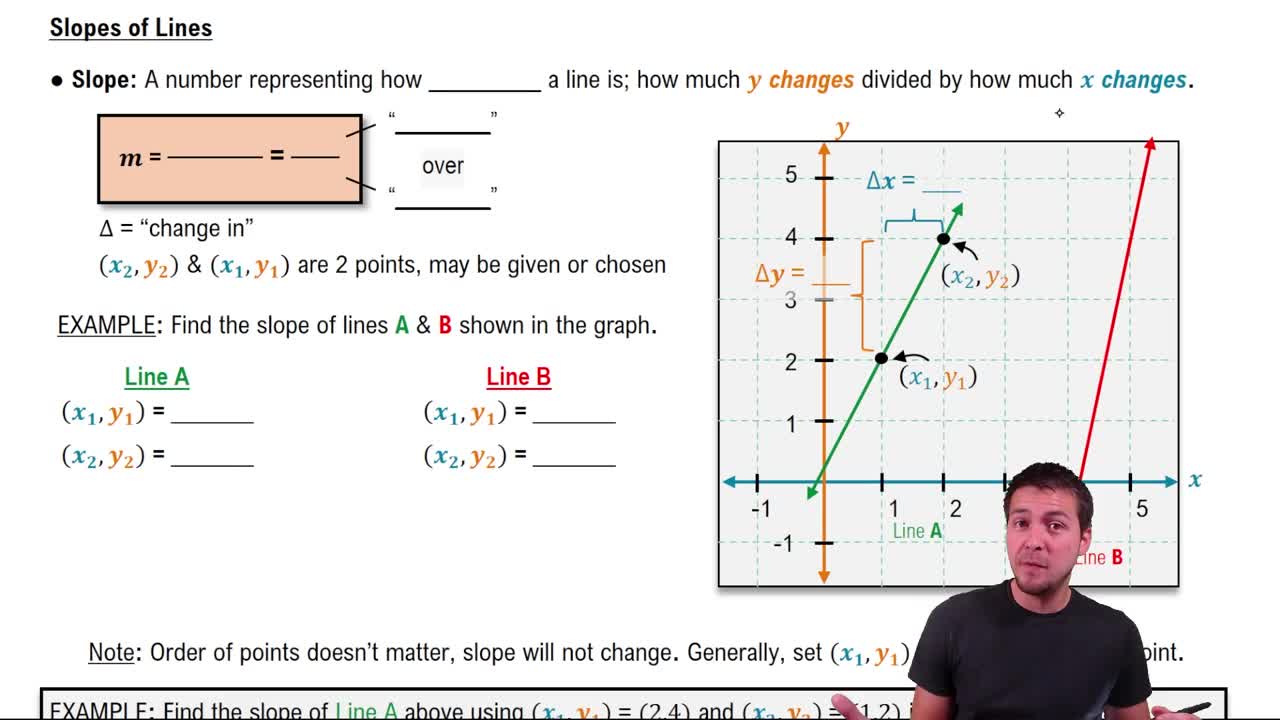
 06:49
06:49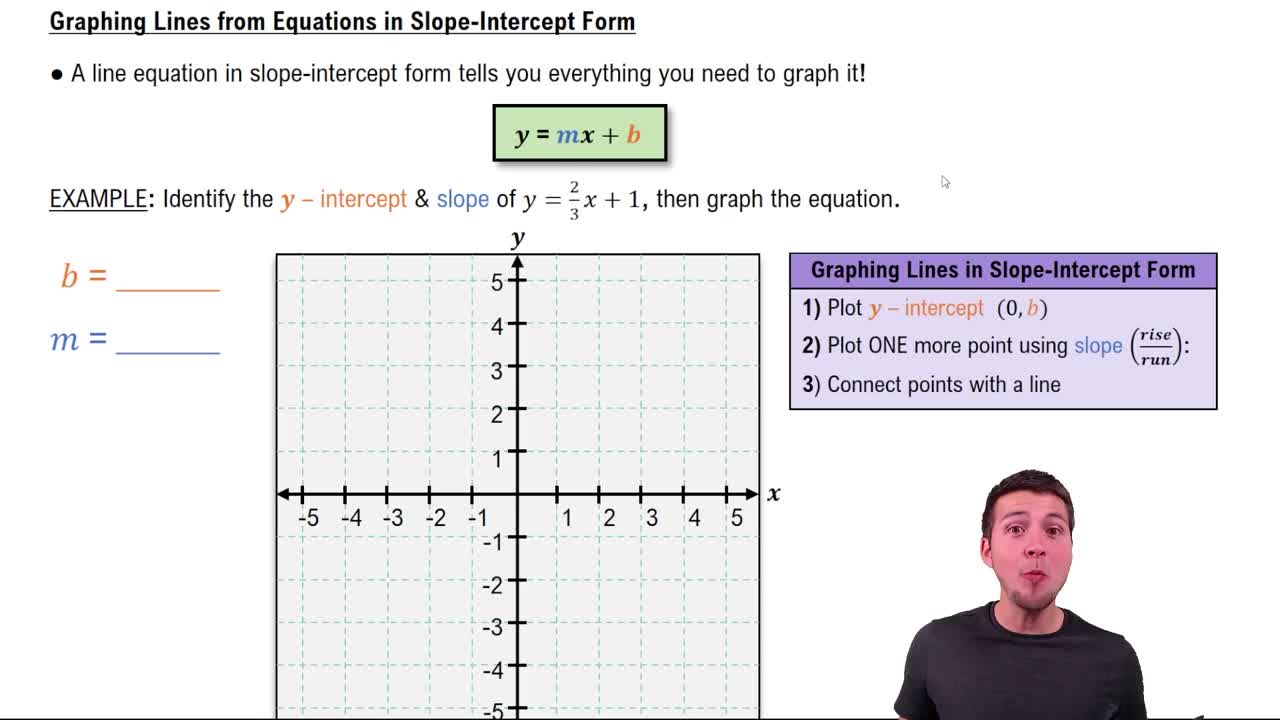 02:35
02:35 06:00
06:00Find the value of the function for the given value of x.
For each function, find (a)ƒ(x+h), (b)ƒ(x+h)-ƒ(x), and (c)[ƒ(x+h)-ƒ(x)]/h.See Example 4.
Find the slope of each line, provided that it has a slope. through (5, 6) and (5, -2)
Let ƒ(x)=-3x+4 and g(x)=-x2+4x+1. Find each of the following. Simplify if necessary. ƒ(0)
Let ƒ(x)=-3x+4 and g(x)=-x2+4x+1. Find each of the following. Simplify if necessary. ƒ(-3)
For each equation, (a) give a table with at least three ordered pairs that are solutions, and (b) graph the equation. y=√(x-3)