Ch. 2 - Graphs and Functions
Lial - College Algebra 13th Edition
Lial13th EditionCollege AlgebraISBN: 9780136881063Not the one you use?Change textbook
Chapter 3, Problem 51

For each equation, (a) give a table with at least three ordered pairs that are solutions, and (b) graph the equation. y=x2

Verified step by step guidance
1
Identify the given equation: \(y = x^2\). This is a quadratic function where \(y\) is the square of \(x\).
Choose at least three values for \(x\). For example, select \(x = -1\), \(x = 0\), and \(x = 2\) to find corresponding \(y\) values.
Calculate the \(y\) values by substituting each chosen \(x\) into the equation \(y = x^2\). For instance, when \(x = -1\), compute \(y = (-1)^2\).
Create a table of ordered pairs \((x, y)\) using the values found. For example, the pairs might look like \((-1, 1)\), \((0, 0)\), and \((2, 4)\).
To graph the equation, plot each ordered pair on the coordinate plane and connect the points with a smooth curve forming a parabola opening upwards.

Verified video answer for a similar problem:

This video solution was recommended by our tutors as helpful for the problem above.
Video duration:
6m

Key Concepts

Here are the essential concepts you must grasp in order to answer the question correctly.

Ordered Pairs as Solutions to Equations

An ordered pair (x, y) represents a solution to an equation if substituting x into the equation yields the corresponding y value. For example, in y = x², if x = 2, then y = 4, so (2, 4) is a solution. Creating a table of such pairs helps visualize the relationship between variables.
Recommended video:
05:28
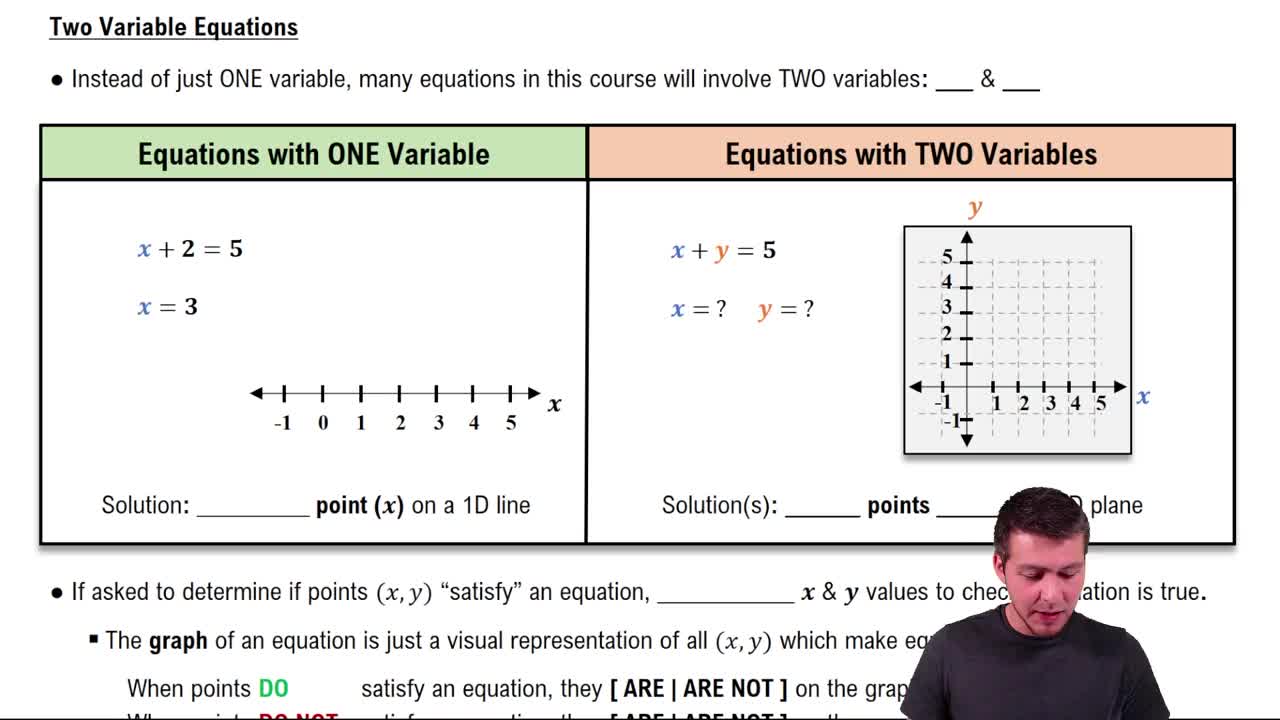
Equations with Two Variables

Quadratic Functions and Their Graphs

A quadratic function has the form y = ax² + bx + c, where the graph is a parabola. For y = x², the parabola opens upward with its vertex at the origin (0,0). Understanding this shape helps in sketching the graph accurately based on the ordered pairs.
Recommended video:
5:26
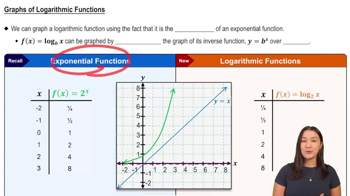
Graphs of Logarithmic Functions

Plotting Points and Graphing Equations

Graphing involves plotting ordered pairs on the coordinate plane and connecting them smoothly. For y = x², plotting points like (-1,1), (0,0), and (1,1) reveals the curve's shape. This visual representation aids in understanding the function's behavior.
Recommended video:
04:29
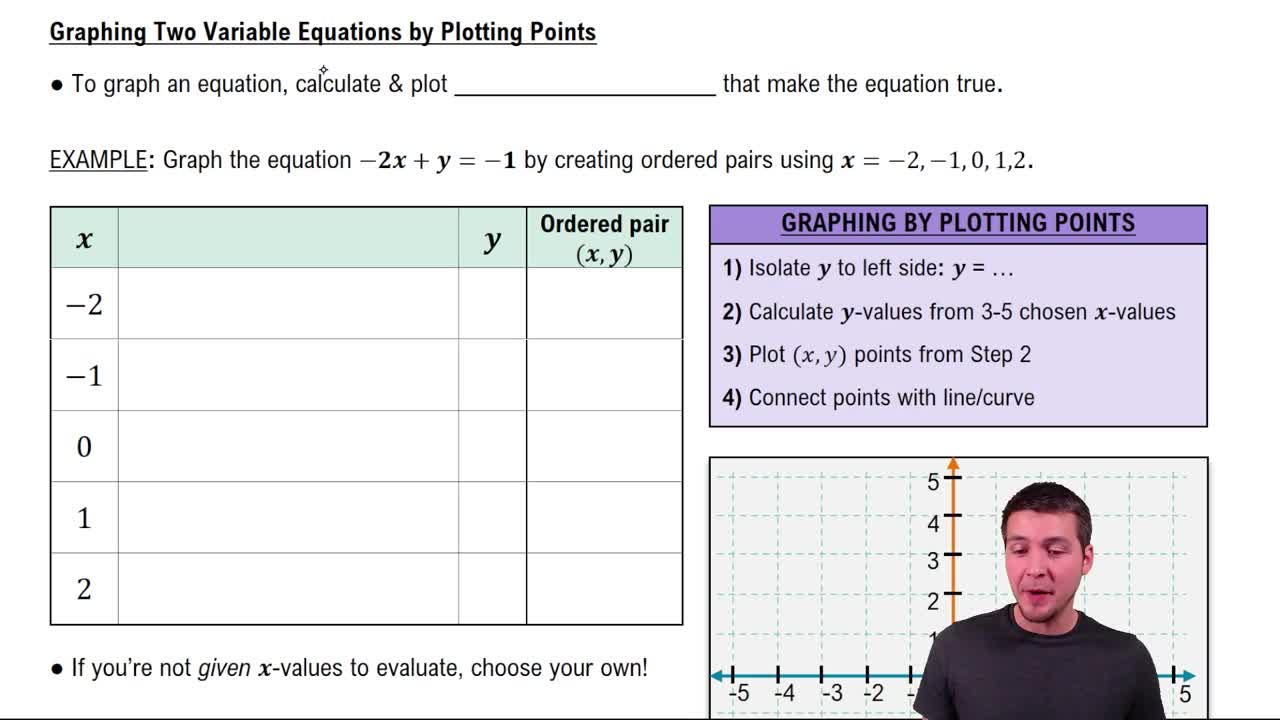
Graphing Equations of Two Variables by Plotting Points