Textbook Question
For each function, find (a) ƒ(2) and (b) ƒ(-1).See Example 7. ƒ = {(2,5),(3,9),(-1,11),(5,3)}
5
views

 Verified step by step guidance
 5:36
5:36 06:49 06:49
For each function, find (a) ƒ(2) and (b) ƒ(-1).See Example 7. ƒ = {(2,5),(3,9),(-1,11),(5,3)}
Graph each function.
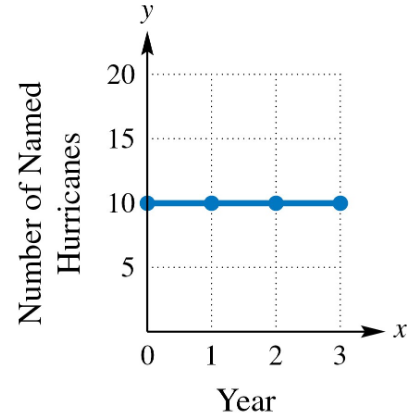
For each line described, write an equation in (a) slope-intercept form, if possible, and (b) standard form. through (3, -5), parallel to y = 4
Graph each function. See Examples 6–8 and the Summary of Graphing Techniques box following Example 9. ƒ(x)=x2+2
Graph each function.
Solve each problem. A graph of y=ƒ(x) is shown in the standard viewing window. Which is the only value of x that could possibly be the solution of the equation ƒ(x) =0? A. -15 B. 0 C. 5 D. 15