Textbook Question
Solve each system for x and y, expressing either value in terms of a or b, if necessary. Assume that a ≠ 0 and b ≠ 0. For the linear function f(x) = mx + b, f(−2) = 11 and ƒ(3) = -9. Find m and b.


 Verified step by step guidance
 05:28
05:28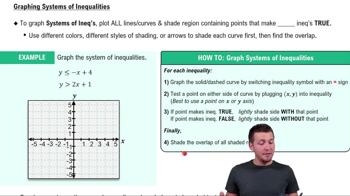 6:19
6:19 5:26
5:26Solve each system for x and y, expressing either value in terms of a or b, if necessary. Assume that a ≠ 0 and b ≠ 0. For the linear function f(x) = mx + b, f(−2) = 11 and ƒ(3) = -9. Find m and b.
Graph the solution set of each system of inequalities or indicate that the system has no solution.
In Exercises 27–62, graph the solution set of each system of inequalities or indicate that the system has no solution. x2+y2<16, y≥2x
In Exercises 47–52, solve each system by the method of your choice.
Find the value of the objective function z = 2x + 3y at each corner of the graphed region shown. What is the maximum value of the objective function? What is the minimum value of the objective function?
Find the length and width of a rectangle whose perimeter is 36 feet and whose area is 77 square feet.