Textbook Question
Graph f(x) = 4x and g(x) = log4 x in the same rectangular coordinate system.

 Verified step by step guidance
 5:46
5:46 4:22
4:22 4:48
4:48Graph f(x) = 4x and g(x) = log4 x in the same rectangular coordinate system.
Evaluate each expression without using a calculator.
Solve each exponential equation in Exercises 23–48. Express the solution set in terms of natural logarithms or common logarithms. Then use a calculator to obtain a decimal approximation, correct to two decimal places, for the solution. e2x−3ex+2=0
Use properties of logarithms to condense each logarithmic expression. Write the expression as a single logarithm whose coefficient is 1. Where possible, evaluate logarithmic expressions without using a calculator. ln x + ln 7
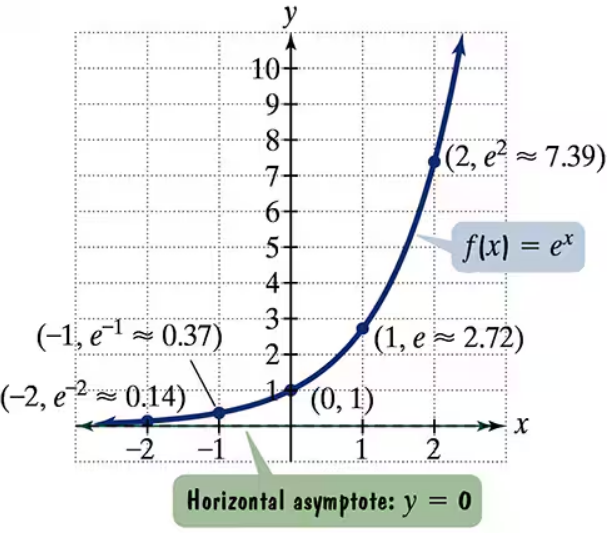
The figure shows the graph of f(x) = ex. In Exercises 35-46, use transformations of this graph to graph each function. Be sure to give equations of the asymptotes. Use the graphs to determine graphs. each function's domain and range. If applicable, use a graphing utility to confirm your hand-drawn h(x) = e2x + 1
Solve each exponential equation in Exercises 23–48. Express the solution set in terms of natural logarithms or common logarithms. Then use a calculator to obtain a decimal approximation, correct to two decimal places, for the solution. 5(2x+3)=3(x−1)