Textbook Question
Solve each polynomial inequality in Exercises 1–42 and graph the solution set on a real number line. Express each solution set in interval notation. (2−x)2(x−7/2)<0
1
views

 Verified step by step guidance
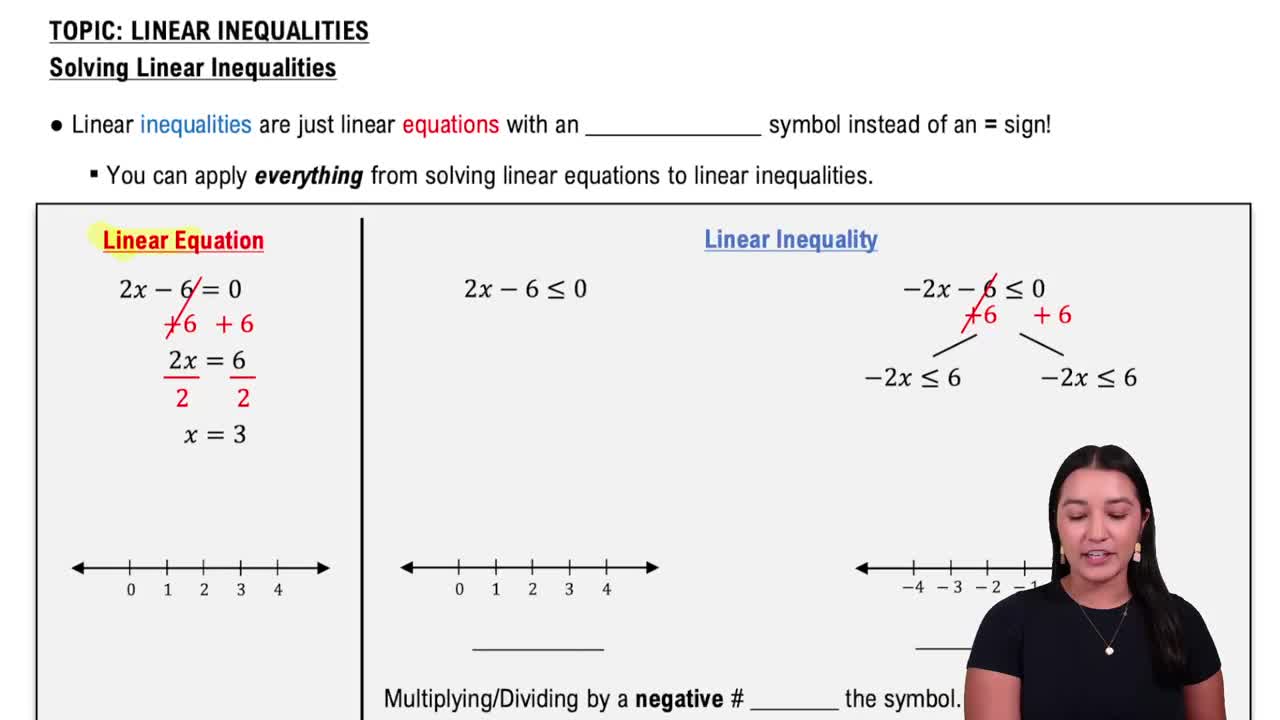
 06:07
06:07 05:46
05:46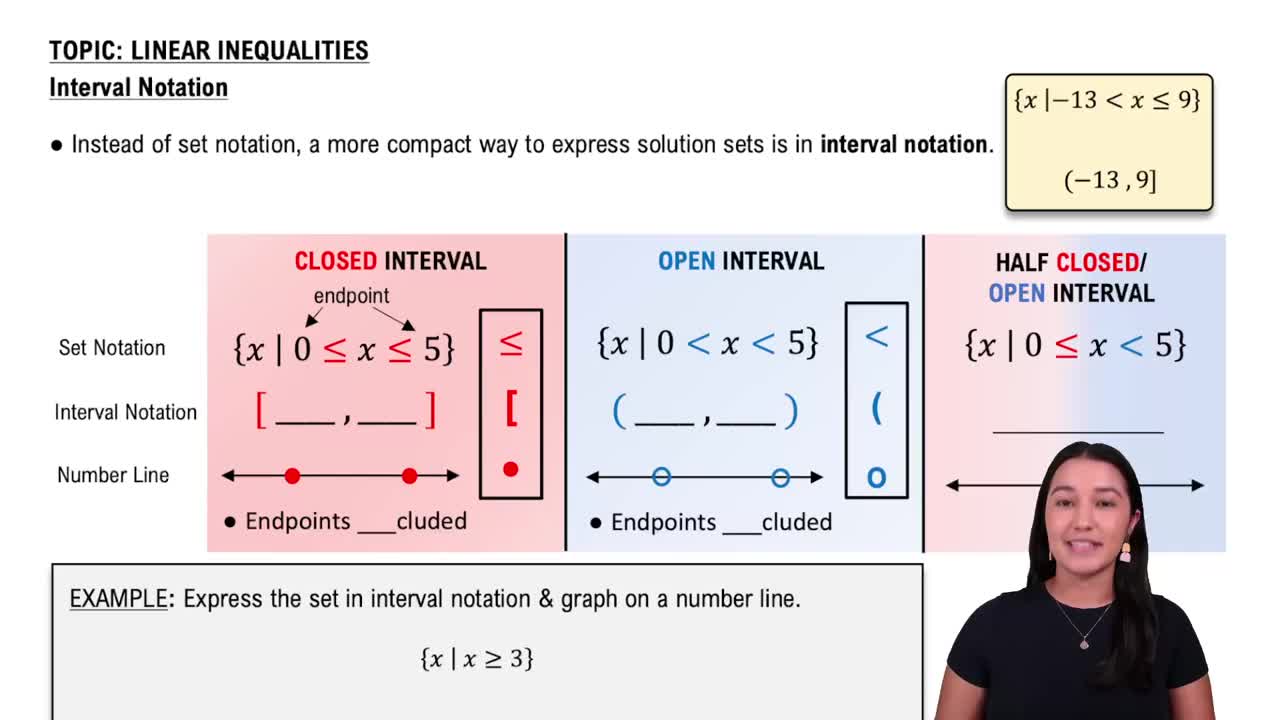 05:18
05:18Solve each polynomial inequality in Exercises 1–42 and graph the solution set on a real number line. Express each solution set in interval notation. (2−x)2(x−7/2)<0
Use synthetic division and the Remainder Theorem to find the indicated function value. f(x)=2x3−11x2+7x−5;f(4)
Find an nth-degree polynomial function with real coefficients satisfying the given conditions. If you are using a graphing utility, use it to graph the function and verify the real zeros and the given function value. n=4; -2, 5, and 3+2i are zeros; f(1) = -96
Find the vertical asymptotes, if any, and the values of x corresponding to holes, if any, of the graph of each rational function. g(x)=(x−3)/(x2−9)
In Exercises 17–38, use the vertex and intercepts to sketch the graph of each quadratic function. Give the equation of the parabola's axis of symmetry. Use the graph to determine the function's domain and range. f(x)=x2+6x+3