Textbook Question
Find the inverse of f(x) = x3 + 2

 Verified step by step guidance
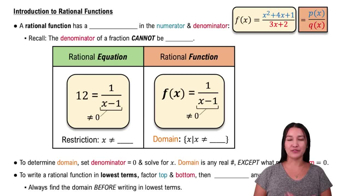
 6:04
6:04 6:24
6:24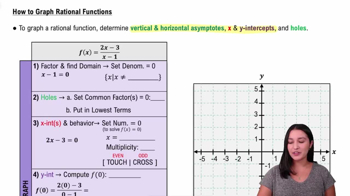 8:19
8:19Find the inverse of f(x) = x3 + 2
Follow the seven steps to graph each rational function. f(x)=−x/(x+1)
Find the domain of each function.
Among all pairs of numbers whose sum is 16, find a pair whose product is as large as possible. What is the maximum product?
Find the domain of each function.
Find the domain of each function.