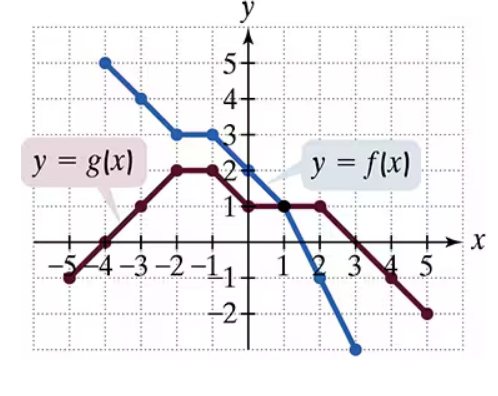
In Exercises 77–92, use the graph to determine a. the function's domain; b. the function's range; c. the x-intercepts, if any; d. the y-intercept, if any; and e. the missing function values, indicated by question marks, below each graph.
Ch. 2 - Functions and Graphs

Chapter 3, Problem 87a
Use the graphs of f and g to solve Exercises 83–90.

Find the domain of ƒ + g.
Verified step by step guidance1
Step 1: Understand the problem. The domain of ƒ + g refers to the set of x-values for which both functions ƒ(x) and g(x) are defined. This means we need to identify the overlap of the domains of ƒ(x) and g(x) from the graph.
Step 2: Analyze the graph of ƒ(x) (blue curve). Observe the x-values for which the blue curve exists. These x-values represent the domain of ƒ(x).
Step 3: Analyze the graph of g(x) (red curve). Observe the x-values for which the red curve exists. These x-values represent the domain of g(x).
Step 4: Determine the intersection of the domains of ƒ(x) and g(x). The domain of ƒ + g is the set of x-values where both ƒ(x) and g(x) are defined simultaneously. Look for the x-values where both curves overlap on the graph.
Step 5: Write the domain of ƒ + g as an interval or union of intervals based on the overlapping x-values identified in Step 4.

Verified video answer for a similar problem:
This video solution was recommended by our tutors as helpful for the problem above.
Video duration:
2mWas this helpful?
Key Concepts
Here are the essential concepts you must grasp in order to answer the question correctly.
Domain of a Function
The domain of a function is the set of all possible input values (x-values) for which the function is defined. For functions f and g, the domain is determined by the x-values for which the graphs of these functions exist. When combining functions, such as in f + g, the domain is restricted to the intersection of the individual domains of f and g.
Recommended video:
Domain Restrictions of Composed Functions
Graphical Representation of Functions
Graphs visually represent functions, showing the relationship between input values (x) and output values (y). In the provided graph, f(x) is depicted in blue and g(x) in red. Analyzing these graphs helps identify where each function is defined, which is crucial for determining the domain of their sum, f + g.
Recommended video:
Relations and Functions
Addition of Functions
The addition of functions, denoted as (f + g)(x), involves combining the output values of f and g for each input x. To find the domain of f + g, one must consider where both functions are defined simultaneously. This means identifying the x-values that are present in both the domain of f and the domain of g, ensuring that the sum is valid.
Recommended video:
Adding & Subtracting Functions Example 1
Related Practice
Textbook Question
Textbook Question
Find a. (f ○ g)(x); b. the domain of (f ○ g). f(x) = (x + 1)/(x - 2), g(x) = 1/x
Textbook Question
Begin by graphing the absolute value function, f(x) = |x|. Then use transformations of this graph to graph the given function. h(x) = -|x+3|
Textbook Question
Use the graphs of f and g to solve Exercises 83–90.
Find the domain of ƒ/g.
7
views
Textbook Question
Use the graphs of f and g to solve Exercises 83–90.
Find(g/f)(3)
Textbook Question
In Exercises 77–92, use the graph to determine a. the function's domain; b. the function's range; c. the x-intercepts, if any; d. the y-intercept, if any; and e. the missing function values, indicated by question marks, below each graph.
