Textbook Question
Find a. (fog) (x) b. the domain of f o g. f(x) = x/(x+1), g(x) = 4/x

 Verified step by step guidance
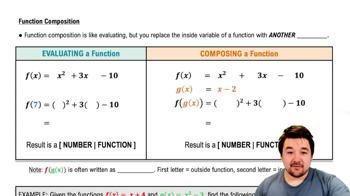
 4:56
4:56 05:10 05:10
Find a. (fog) (x) b. the domain of f o g. f(x) = x/(x+1), g(x) = 4/x
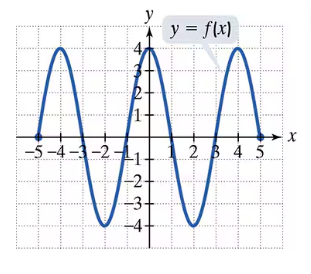
Use the graph of g to solve Exercises 71–76.
Find g(-4)
Graph both equations in the same rectangular coordinate system and find all points of intersection. Then show that these ordered pairs satisfy the equations. (x − 2)²+(y+3)² = 4, y = x - 3
Begin by graphing the square root function, f(x) = √x. Then use transformations of this graph to graph the given function. g(x) = √(x+1)
Find a. (fog) (x) b. the domain of f o g.
f(x) = √x, g(x) = x − 2
In Exercises 67–69, begin by graphing the absolute value function, f(x) = |x|. Then use transformations of this graph to graph the given function. r(x) = (1/2) |x + 2|