Textbook Question
Use the given conditions to write an equation for each line in point-slope form and slope-intercept form. Slope = - 3/5, passing through (10, −4)

 Verified step by step guidance
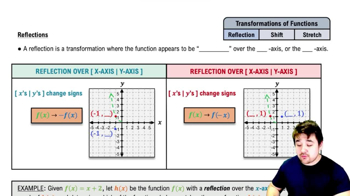
 5:00
5:00 02:16
02:16 05:10
05:10Use the given conditions to write an equation for each line in point-slope form and slope-intercept form. Slope = - 3/5, passing through (10, −4)
In Exercises 11–26, determine whether each equation defines y as a function of x. |x| − y = 2
The functions in Exercises 11-28 are all one-to-one. For each function, a. Find an equation for f-1(x), the inverse function. b. Verify that your equation is correct by showing that f(ƒ-1 (x)) = = x and ƒ-1 (f(x)) = x. f(x) = (x +4)/(x-2)
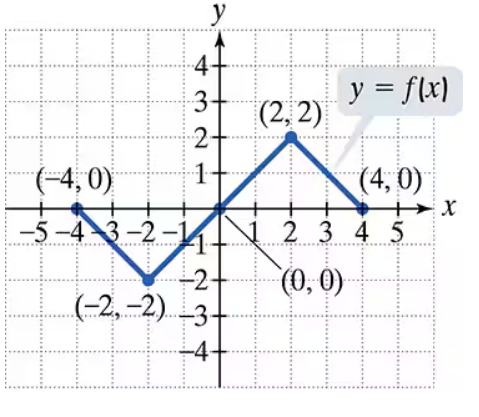
Use the graph of y = f(x) to graph each function g.
g(x) = f(-x)+1
Write an equation in slope-intercept form of a linear function f whose graph satisfies the given conditions. The graph of ƒ is perpendicular to the line whose equation is 3x - 2y - 4 = 0 and has the same y-intercept as this line.
In Exercises 11–26, determine whether each equation defines y as a function of x. xy - 5y =1