The functions in Exercises 11-28 are all one-to-one. For each function, a. Find an equation for f-1(x), the inverse function. b. Verify that your equation is correct by showing that f(ƒ-1 (x)) = = x and ƒ-1 (f(x)) = x. f(x) = x³ +2
Ch. 2 - Functions and Graphs

Chapter 3, Problem 17
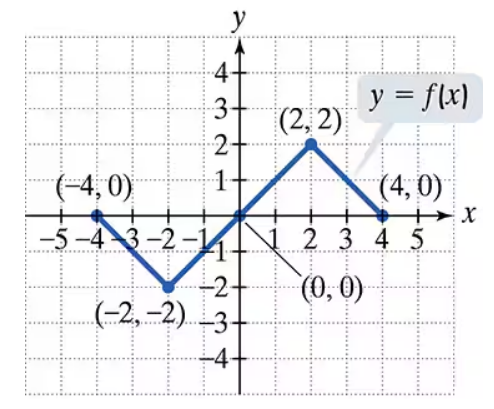
Use the graph of y = f(x) to graph each function g.

g(x) = f(x) - 1
Verified step by step guidance1
Step 1: Understand the transformation g(x) = f(x) - 1. This represents a vertical shift of the graph of f(x) downward by 1 unit. Each point on the graph of f(x) will have its y-coordinate decreased by 1.
Step 2: Identify key points on the graph of f(x). The given graph has three notable points: (-3, 0), (3, 0), and (0, -9). These points will be transformed according to the vertical shift.
Step 3: Apply the transformation to each key point. For the point (-3, 0), subtract 1 from the y-coordinate to get (-3, -1). For the point (3, 0), subtract 1 from the y-coordinate to get (3, -1). For the point (0, -9), subtract 1 from the y-coordinate to get (0, -10).
Step 4: Plot the transformed points on the graph. The new points are (-3, -1), (3, -1), and (0, -10). These points represent the graph of g(x).
Step 5: Draw the graph of g(x) by connecting the transformed points smoothly, maintaining the same shape as the original graph of f(x), but shifted downward by 1 unit.

Verified video answer for a similar problem:
This video solution was recommended by our tutors as helpful for the problem above.
Video duration:
1mKey Concepts
Here are the essential concepts you must grasp in order to answer the question correctly.
Function Transformation
Function transformation refers to the changes made to the graph of a function based on modifications to its equation. In this case, g(x) = f(x) - 1 represents a vertical shift downward by 1 unit. Understanding how transformations affect the graph is crucial for accurately sketching the new function.
Recommended video:
Domain & Range of Transformed Functions
Graphing Quadratic Functions
Quadratic functions, typically in the form f(x) = ax^2 + bx + c, produce parabolic graphs. The given function f(x) has roots at (-3, 0) and (3, 0), indicating it opens upwards. Recognizing the shape and key features of quadratic graphs is essential for applying transformations correctly.
Recommended video:
Graphs of Logarithmic Functions
Identifying Key Points
Key points on a graph, such as intercepts and vertices, are critical for sketching functions accurately. In the provided graph, points like (0, -9) represent the vertex, while (-3, 0) and (3, 0) are x-intercepts. Identifying these points helps in understanding how the graph of g(x) will shift from f(x).
Recommended video:
Identifying Intervals of Unknown Behavior
Related Practice
Textbook Question
Textbook Question
In Exercises 11–26, determine whether each equation defines y as a function of x. x = y²
Textbook Question
Find the distance between each pair of points. If necessary, express answers in simplified radical form and then round to two decimal places. (-1/4, -1/7) and (3/4, 6/7)
1
views
Textbook Question
Find the domain of each function. f(x) = √(x - 3)
6
views
Textbook Question
Find the average rate of change of the function from x1 to x2. f(x) = √x from x1 = 4 to x2 = 9
Textbook Question
Find the distance between each pair of points. If necessary, express answers in simplified radical form and then round to two decimal places. (7/3, 1/5) and (1/3, 6/5)
1
views