Textbook Question
Solve and graph the solution set on a number line: 3|2x-1| ≥ 21

 Verified step by step guidance
 4:56
4:56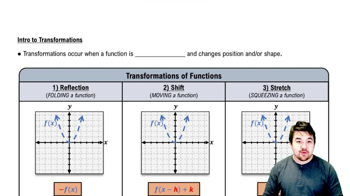 5:25
5:25 4:26
4:26Solve and graph the solution set on a number line: 3|2x-1| ≥ 21
Begin by graphing the standard cubic function, f(x) = x³. Then use transformations of this graph to graph the given function. h(x) = (1/2)(x − 2)³ – 1
Exercises 103–105 will help you prepare for the material covered in the next section. Let (x1, y₁) = (7, 2) and (x2, y2) = (1, −1). Find √[(x2 − x1)² + (y2 − y₁)²]. Express the - answer in simplified radical form.
In Exercises 105–106, find the midpoint of each line segment with the given endpoints. (2, 6) and (-12, 4)
Exercises 103–105 will help you prepare for the material covered in the next section. Solve by completing the square: y² – 6y — 4 = 0.
Exercises 103–105 will help you prepare for the material covered in the next section. Use a rectangular coordinate system to graph the circle with center (1, -1) and radius 1.