Textbook Question
Solve and check each linear equation. 3(x - 1) = 21
13
views


 Verified step by step guidance
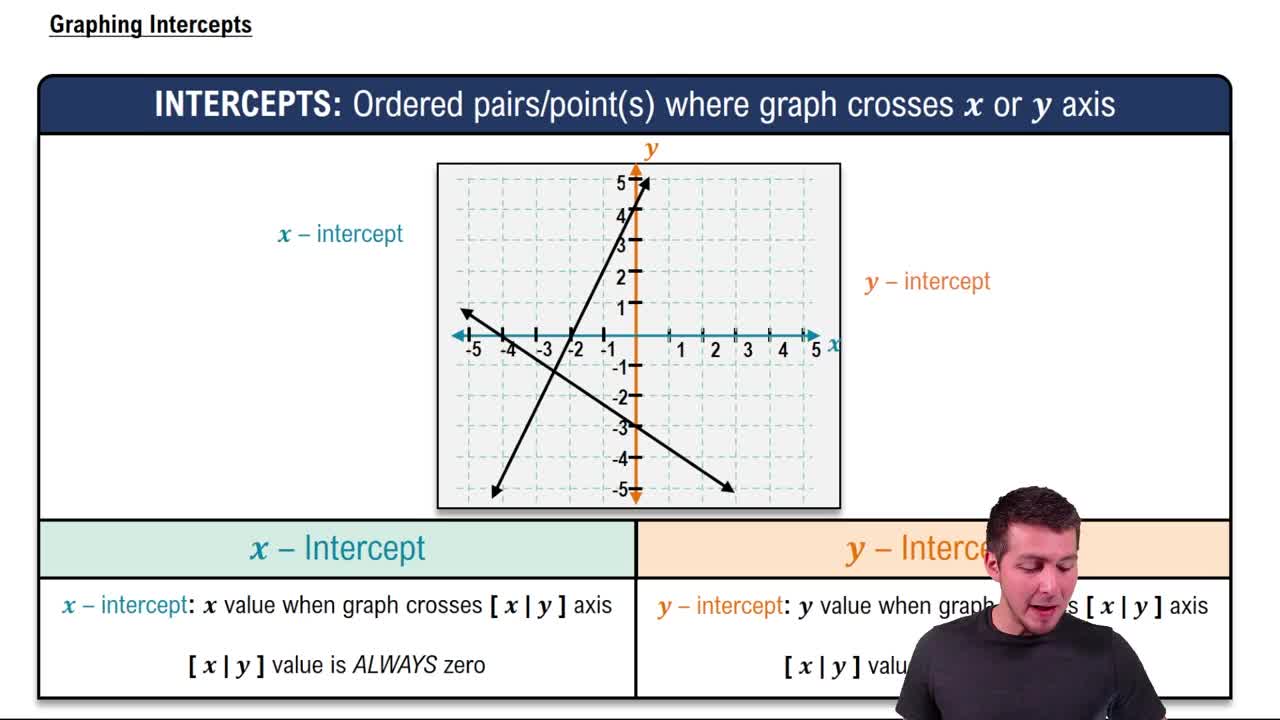
 04:08 04:08
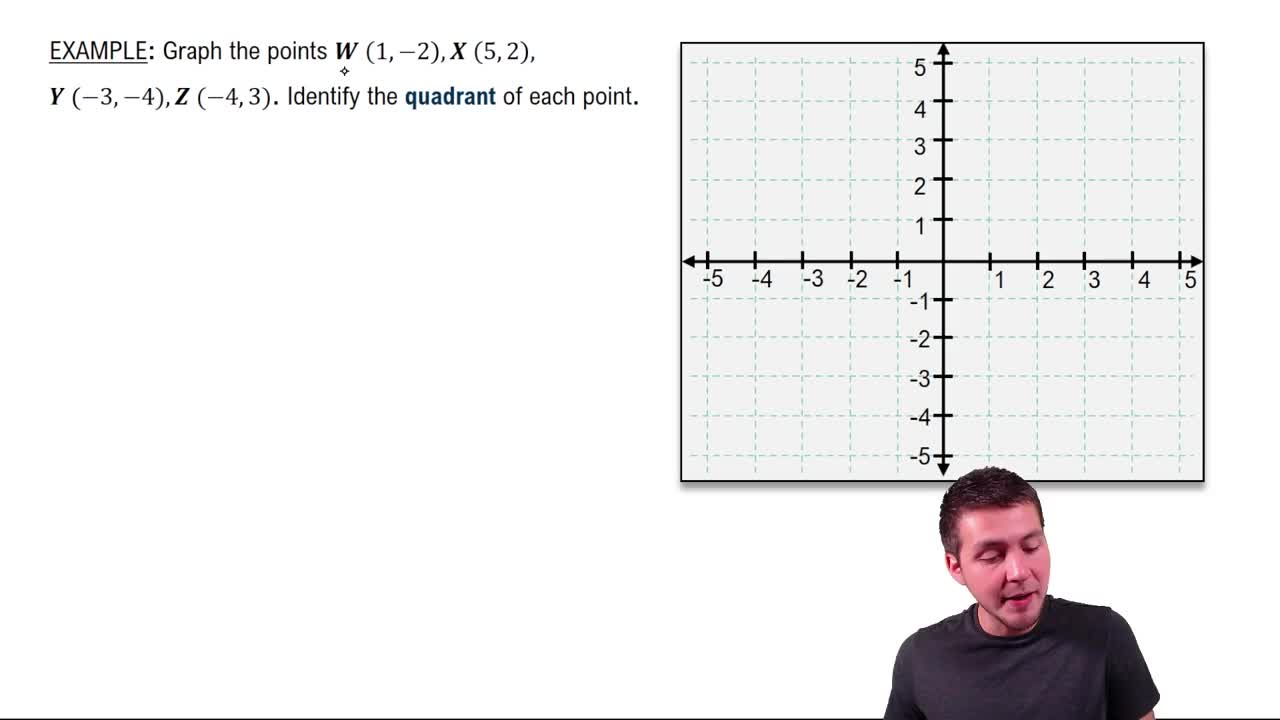 02:16
02:16Solve and check each linear equation. 3(x - 1) = 21
In Exercises 1–8, add or subtract as indicated and write the result in standard form. 6 - (- 5 + 4i) - (- 13 - i)
Solve each equation in Exercises 1 - 14 by factoring.
In Exercises 6–8, use the graph and determine the x-intercepts if any, and the y-intercepts if any. For each graph, tick marks along the axes represent one unit each.
Plot the given point in a rectangular coordinate system. (- 4, - 2)
In Exercises 1–8, add or subtract as indicated and write the result in standard form. 8i - (14 - 9i)