Textbook Question
In all exercises, other than exercises with no solution, use interval notation to express solution sets and graph each solution set on a number line. In Exercises 27–50, solve each linear inequality. 1 - x/2 > 4
1
views

 Verified step by step guidance
 04:08 04:08
 02:16
02:16In all exercises, other than exercises with no solution, use interval notation to express solution sets and graph each solution set on a number line. In Exercises 27–50, solve each linear inequality. 1 - x/2 > 4
In Exercises 37–52, perform the indicated operations and write the result in standard form. (- 3 - √-7)2
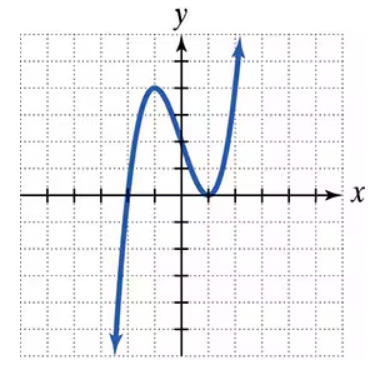
Use the graph to a. determine the x-intercepts, if any; b. determine the y-intercepts, if any. For each graph, tick marks along the axes represent one unit each.
Exercises 41–60 contain rational equations with variables in denominators. For each equation, a. write the value or values of the variable that make a denominator zero. These are the restrictions on the variable. b. Keeping the restrictions in mind, solve the equation. 7/2x - 5/3x = 22/3
Solve each equation in Exercises 41–60 by making an appropriate substitution.