Textbook Question
Find each product and write the result in standard form. (7 - 5i)(- 2 - 3i)

 Verified step by step guidance
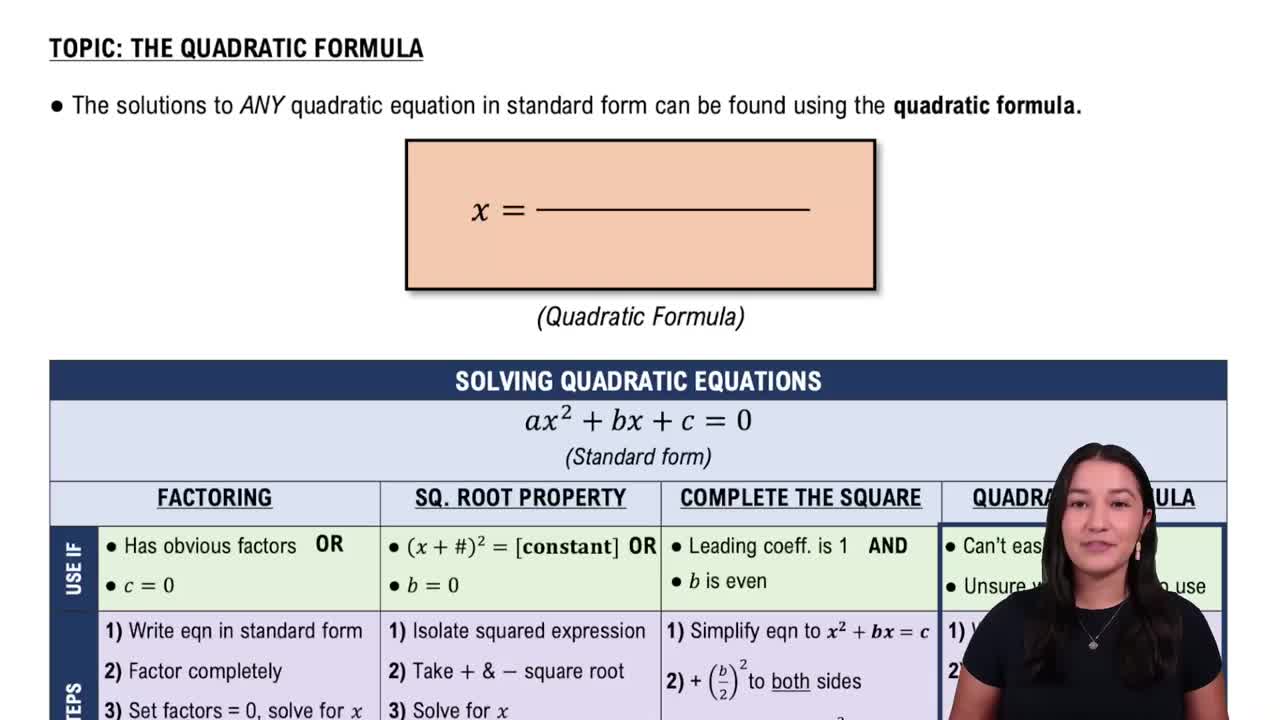
 06:36
06:36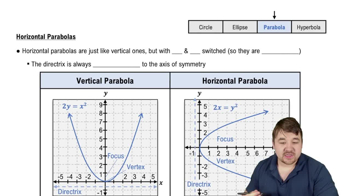 5:28
5:28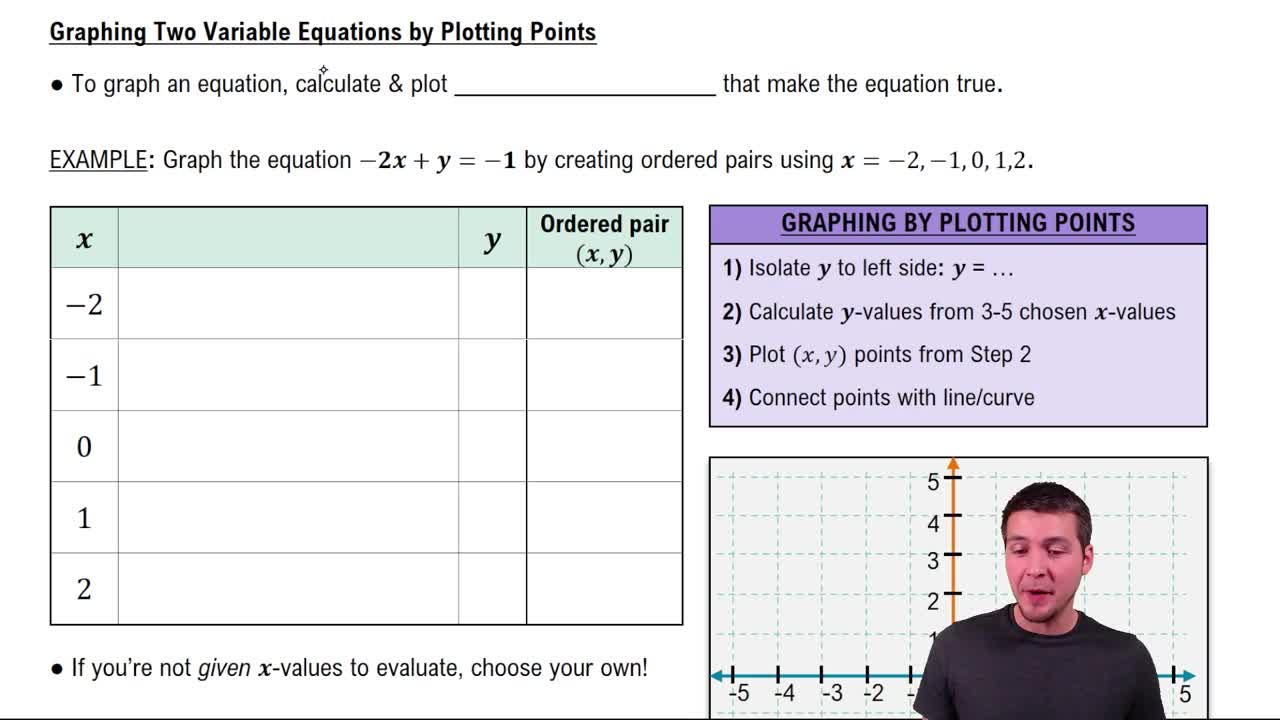 04:29
04:29Find each product and write the result in standard form. (7 - 5i)(- 2 - 3i)
Solve each equation in Exercises 15–34 by the square root property.
Graph each equation in Exercises 13 - 28. Let x = - 3, - 2, - 1, 0, 1, 2, 3
y = x2 + 2
Solve each radical equation in Exercises 11–30. Check all proposed solutions. √(x + 3) = x - 3
Solve each equation in Exercises 1 - 14 by factoring. 10x - 1 = (2x + 1)2
In Exercises 1–26, solve and check each linear equation. 7x + 4 = x + 16