Ch. 1 - Equations and Inequalities
Blitzer - College Algebra 8th Edition
Blitzer8th EditionCollege AlgebraISBN: 9780136970514Not the one you use?Change textbook
Chapter 2, Problem 16a

Graph each equation in Exercises 13 - 28. Let x = - 3, - 2, - 1, 0, 1, 2, 3
y = x + 2

Verified step by step guidance
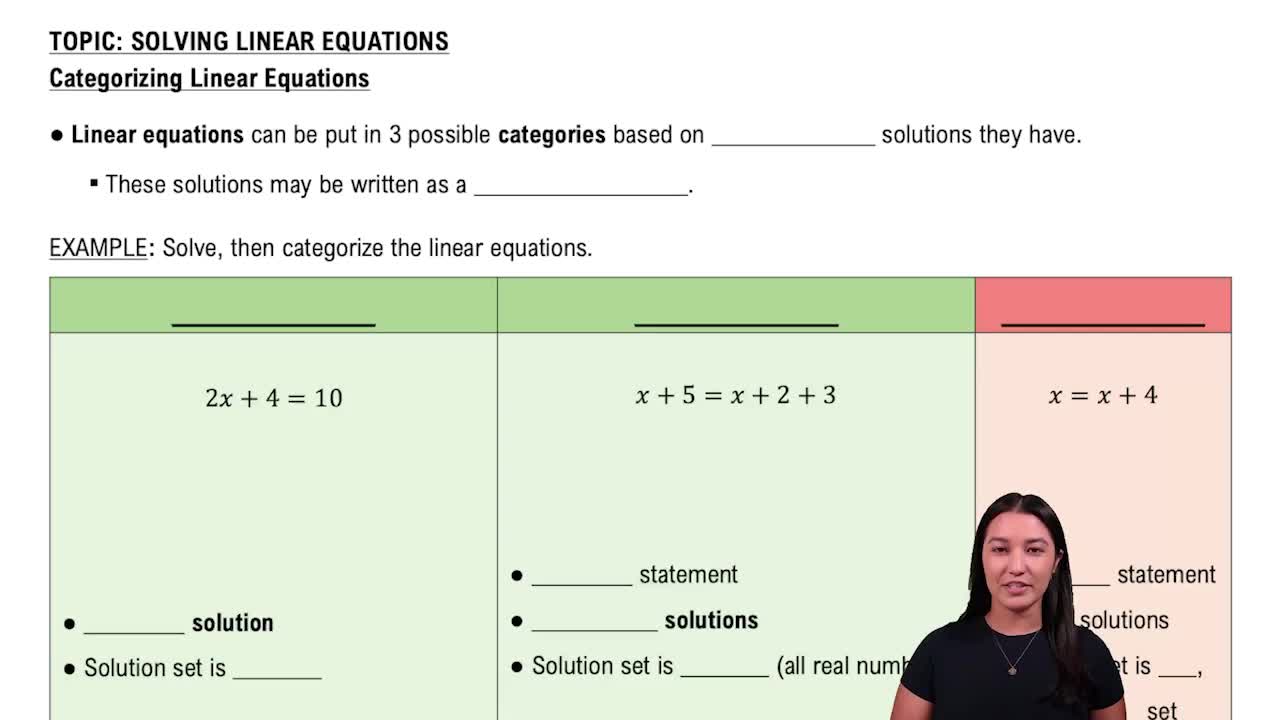
1
Identify the given equation: y = x + 2. This is a linear equation, which means its graph will be a straight line.
Create a table of values for x and y. Use the given x-values (-3, -2, -1, 0, 1, 2, 3). For each x-value, substitute it into the equation y = x + 2 to calculate the corresponding y-value.
For example, when x = -3, substitute into the equation: y = -3 + 2. Similarly, calculate y for all other x-values.
Plot the points (x, y) on a coordinate plane. Each pair of x and y values forms a point, such as (-3, -1), (-2, 0), etc.
Draw a straight line through all the plotted points. Since this is a linear equation, the points should align perfectly, forming a straight line.

Verified video answer for a similar problem:

This video solution was recommended by our tutors as helpful for the problem above.
Video duration:
1m
Was this helpful?

Key Concepts

Here are the essential concepts you must grasp in order to answer the question correctly.

Linear Equations

A linear equation is an algebraic expression that represents a straight line when graphed on a coordinate plane. It typically takes the form y = mx + b, where m is the slope and b is the y-intercept. Understanding linear equations is essential for graphing, as it allows students to identify the relationship between variables and predict values.
Recommended video:
06:00
Categorizing Linear Equations

Graphing Points

Graphing points involves plotting specific coordinates on a Cartesian plane, where the x-coordinate indicates the horizontal position and the y-coordinate indicates the vertical position. For the equation y = x + 2, students will calculate y for given x values, such as -3, -2, -1, etc., and plot these points to visualize the linear relationship.
Recommended video:
Guided course
04:29
Graphing Equations of Two Variables by Plotting Points

Slope and Y-Intercept

The slope of a line indicates its steepness and direction, calculated as the change in y over the change in x (rise/run). The y-intercept is the point where the line crosses the y-axis, represented by the value of y when x is zero. In the equation y = x + 2, the slope is 1 and the y-intercept is 2, which are crucial for understanding the line's behavior and graphing it accurately.
Recommended video:
Guided course
03:56
Slope-Intercept Form