 Back
BackCollege Algebra: Graphs, Intercepts, Domain, and Range
 02:16
02:16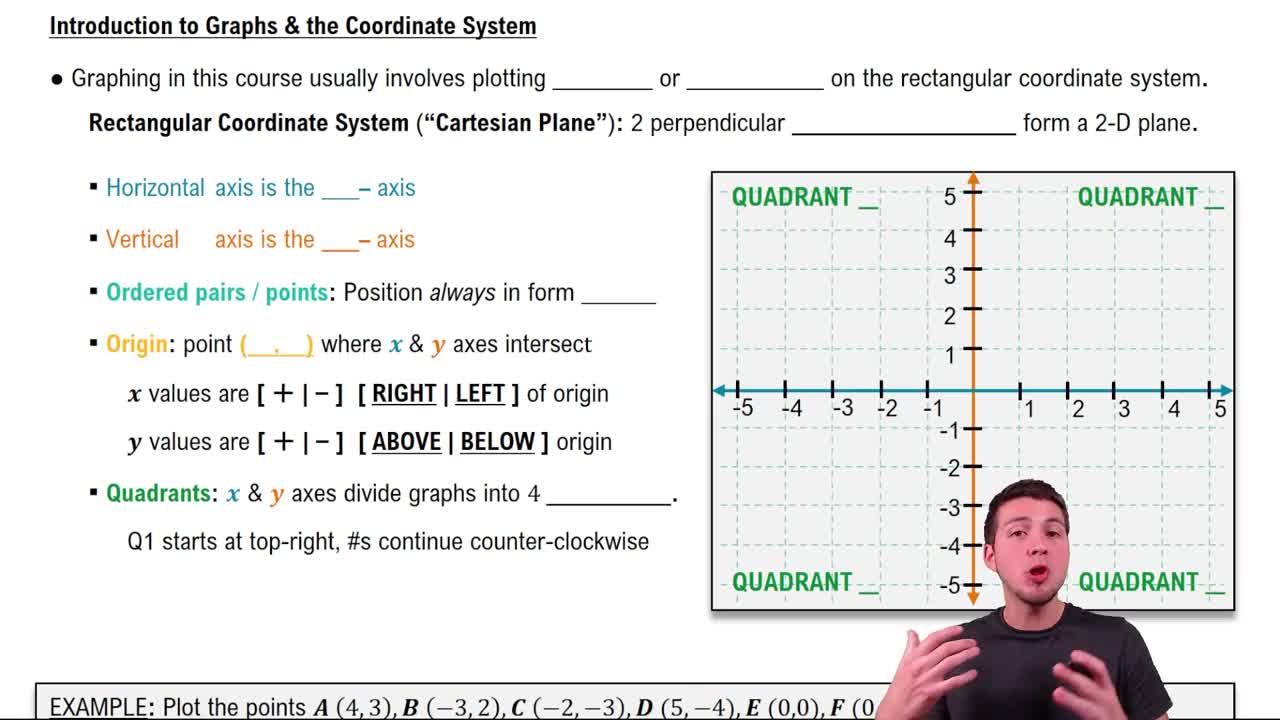
Terms in this set (20)
The x-intercept is the point(s) where the graph crosses the x-axis, where \(y=0\) or \(f(x)=0\).
The domain is the set of all possible x-values for which the function is defined, found by looking at the leftmost and rightmost points on the graph along the x-axis.
Domain is written as \(\{x\mid \text{condition on } x\}\), for example, \(\{x\mid a \leq x \leq b\}\) where a and b are endpoints.
Locate y = 5 on the vertical axis, draw a horizontal line at y = 5, and find the x-coordinate(s) where this line intersects the graph.
Find x = 1 on the x-axis, move vertically to the graph, and read the corresponding y-value, which is \(f(1)\).
The range is the set of all y-values that the function attains, found by looking at the lowest and highest points on the graph.
Check if endpoints have closed circles or solid lines (included, use ≤ or ≥) or open circles/gaps (excluded, use < or >).
Convert to decimals if needed, move left 3.5 units on x-axis, then up 4.5 units on y-axis, and mark the point.
The y-intercept is the point where the graph crosses the y-axis, where \(x=0\).
Find points where the graph crosses the x-axis (x-intercepts) and the point where it crosses the y-axis (y-intercept).
It represents the set of all x-values between a and b, including the endpoints a and b.
An open circle means the endpoint is excluded from the domain or range, so use < or > in notation.
A closed circle means the endpoint is included in the domain or range, so use ≤ or ≥ in notation.
The domain is \(\{x\mid -\infty < x < \infty\}\) or simply all real numbers.
It represents the root or zero of the function where \(f(x)=0\).
The range includes all y-values up to the maximum y-value, including it if the graph has a closed circle or solid line at that point.
The range includes all y-values starting from the minimum y-value, including it if the graph has a closed circle or solid line at that point.
The function is not defined at those x-values, so those points are excluded from the domain.
It is the y-coordinate of the point on the graph where x = c.
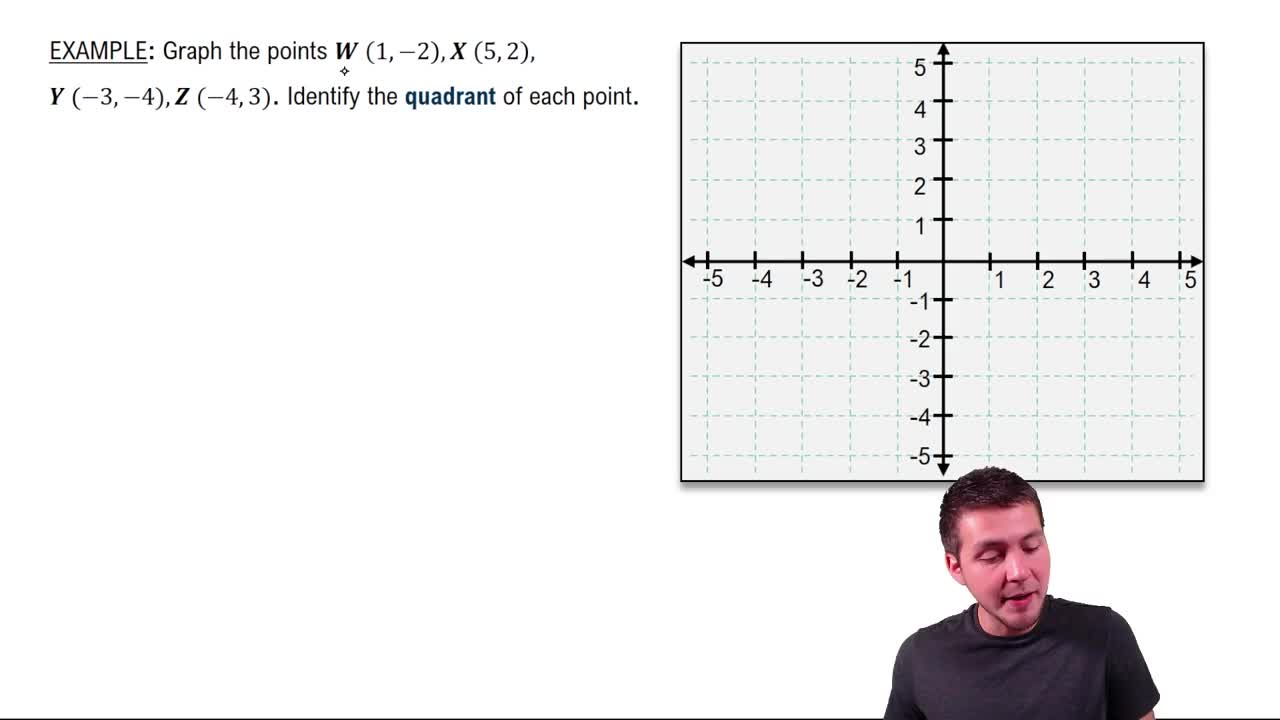
A plane defined by a horizontal x-axis and a vertical y-axis used to plot points as (x, y).