
Textbook Question
Begin by graphing the absolute value function, f(x) = |x|. Then use transformations of this graph to graph the given function. g(x) = -2|x+3|+2
 Verified step by step guidanceVerified video answer for a similar problem:
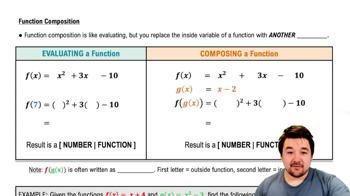
 4:56
4:56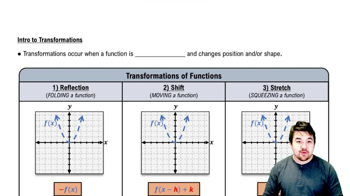 5:25
5:25 4:26
4:26