Graph each polynomial function. Factor first if the polynomial is not in factored form. ƒ(x)=-2x(x-3)(x+2)
Verified step by step guidance
1
Identify the given polynomial function: \(f(x) = -2x(x-3)(x+2)\). Notice that it is already factored into three linear factors multiplied together.
Determine the zeros of the function by setting each factor equal to zero: \(x = 0\), \(x - 3 = 0 \Rightarrow x = 3\), and \(x + 2 = 0 \Rightarrow x = -2\). These are the x-intercepts of the graph.
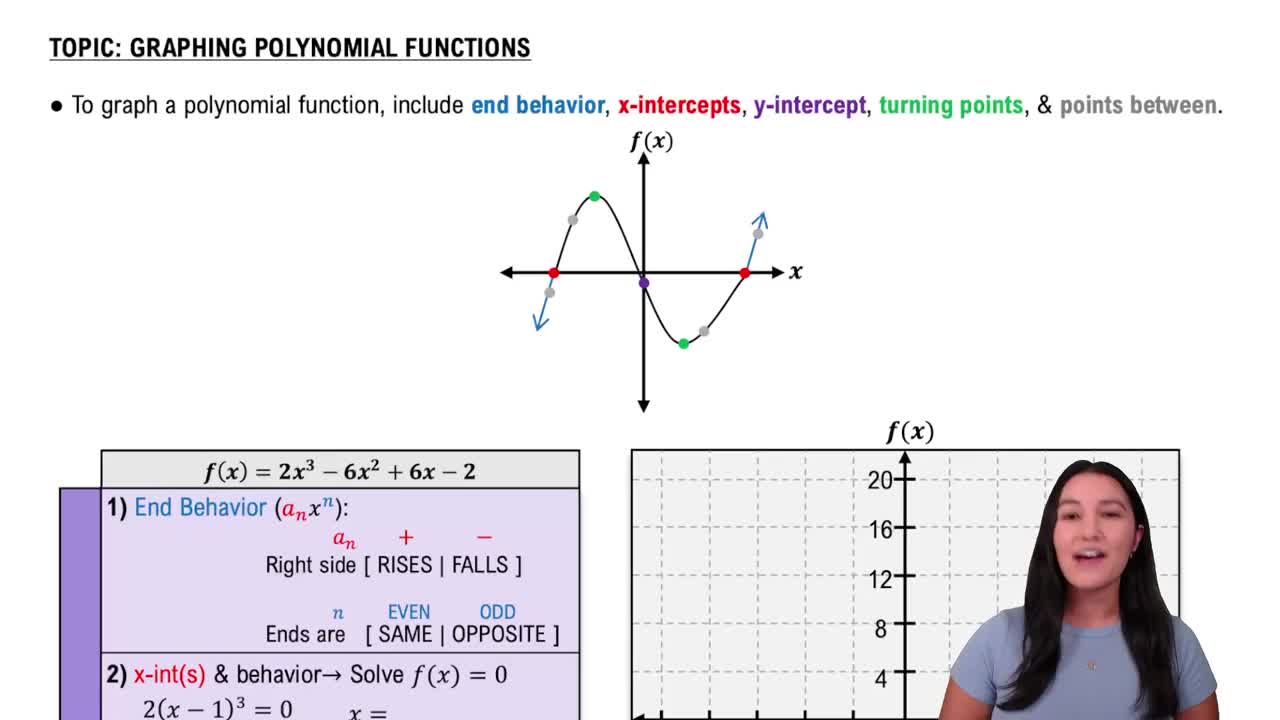
Analyze the leading coefficient and degree to understand the end behavior. The leading term comes from multiplying \(-2x\), \(x\), \(x-3\), and \(x+2\). Since there are three linear factors and a coefficient of \(-2\), the degree is 3 (odd degree) and the leading coefficient is negative, so the graph falls to the right and rises to the left.
Find the y-intercept by evaluating \(f(0)\). Substitute \(x=0\) into the function: \(f(0) = -2 \times 0 \times (0-3) \times (0+2)\). This will give the point where the graph crosses the y-axis.
Plot the zeros and the y-intercept on the coordinate plane. Then, sketch the graph using the end behavior and the fact that the graph crosses the x-axis at the zeros. The graph will pass through each zero and change direction accordingly.
Verified video answer for a similar problem:
This video solution was recommended by our tutors as helpful for the problem above
Video duration:
6m
Play a video:
0 Comments
Key Concepts
Here are the essential concepts you must grasp in order to answer the question correctly.
Factoring Polynomial Functions
Factoring involves expressing a polynomial as a product of its factors, which simplifies finding roots and analyzing the function. In this question, the polynomial is already factored as -2x(x-3)(x+2), making it easier to identify zeros and graph the function.
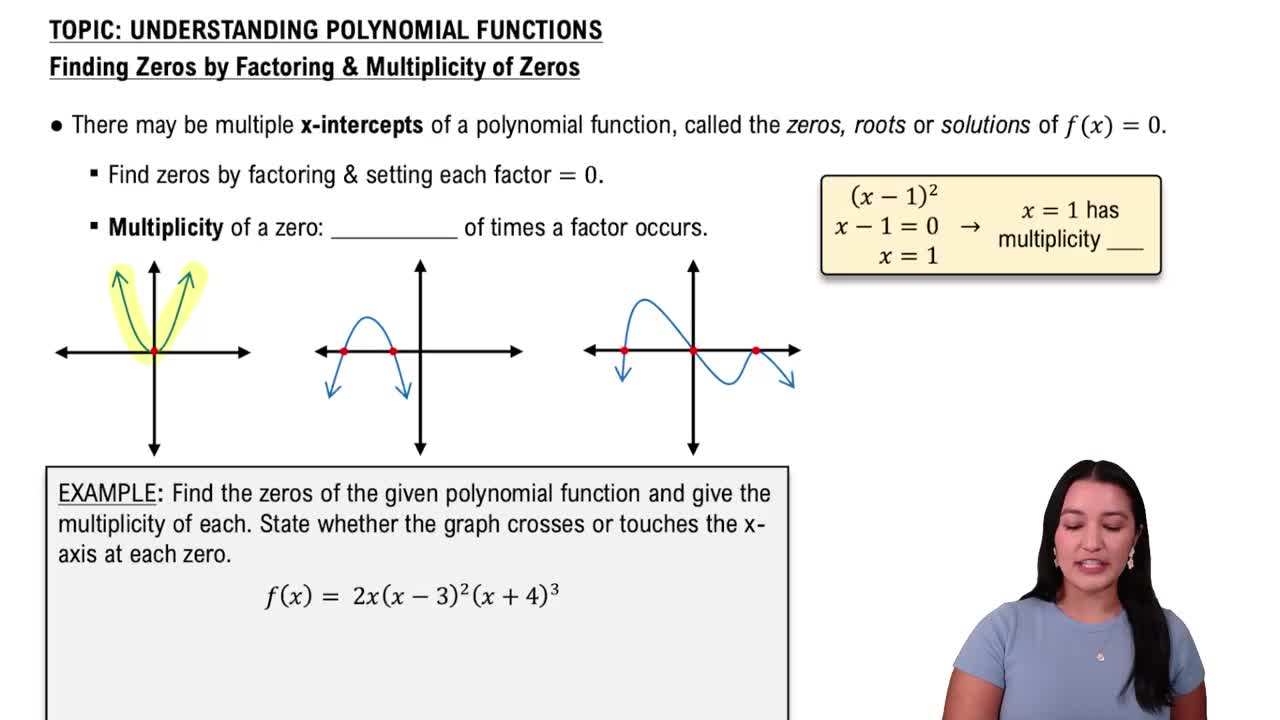
The zeros (or roots) of a polynomial are the values of x that make the function equal to zero. They correspond to the x-intercepts on the graph. For the given function, zeros occur where each factor equals zero: x = 0, x = 3, and x = -2.
Graphing involves plotting key points such as zeros and determining the end behavior based on the leading coefficient and degree. The negative leading coefficient (-2) indicates the graph will fall to the right, and the multiplicity of roots affects whether the graph crosses or touches the x-axis at those points.

 Verified step by step guidance
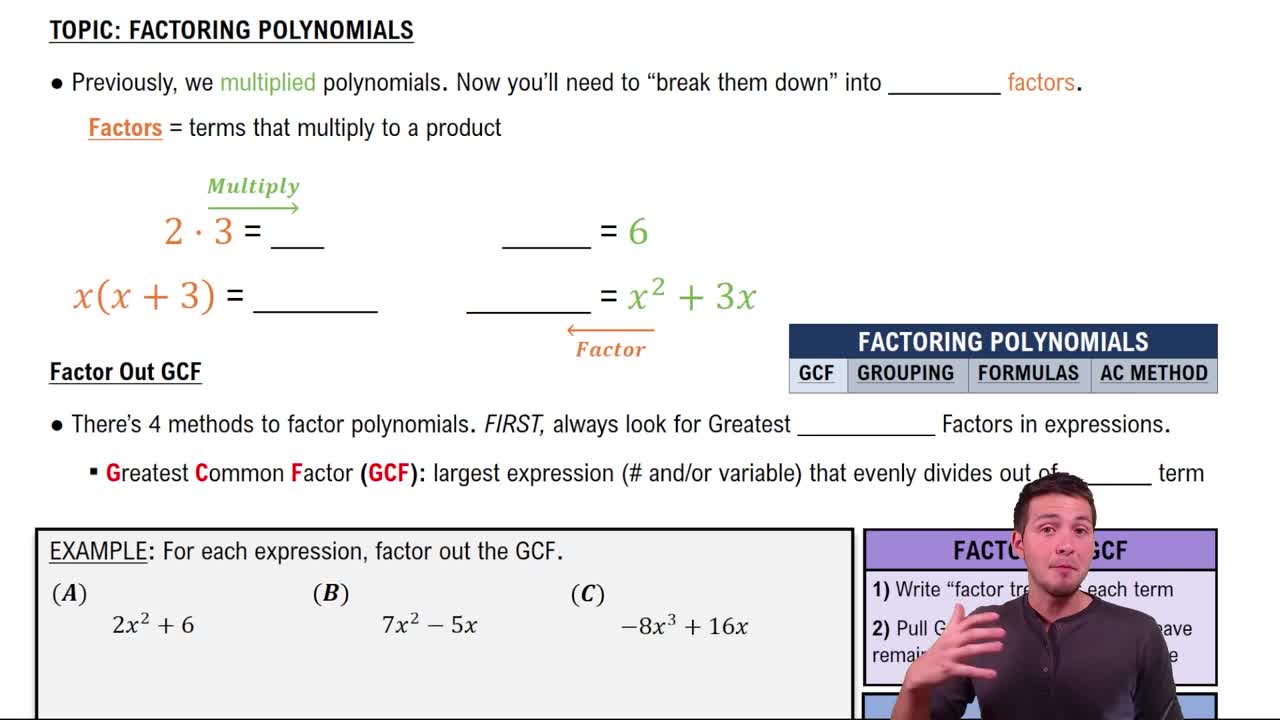
 07:30
07:30