Use the graph of y = f(x) to graph each function g. g(x) = ½ f(x)
Verified step by step guidance
1
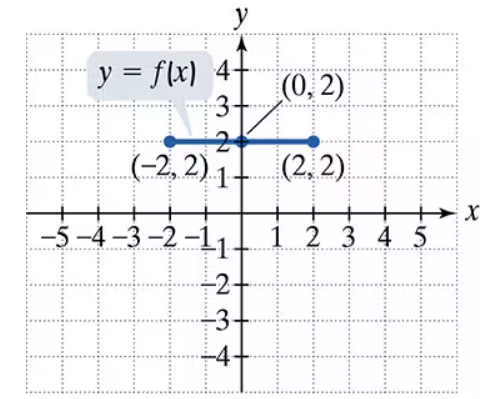
Step 1: Observe the graph of y = f(x). It is a horizontal line segment from (1, -3) to (4, -3). This means that the function f(x) has a constant value of -3 for all x in the interval [1, 4].
Step 2: The new function g(x) = ½ f(x) involves scaling the values of f(x) by a factor of ½. Since f(x) = -3, g(x) = ½ * (-3) = -3/2 for all x in the interval [1, 4].
Step 3: To graph g(x), keep the x-values the same (from 1 to 4), but adjust the y-values to reflect the scaled value of -3/2. This means the new graph will be a horizontal line segment at y = -3/2.
Step 4: Plot the points (1, -3/2) and (4, -3/2) on the graph. These points represent the endpoints of the horizontal line segment for g(x).
Step 5: Draw a horizontal line segment connecting the points (1, -3/2) and (4, -3/2). This is the graph of g(x) = ½ f(x).
Verified video answer for a similar problem:
This video solution was recommended by our tutors as helpful for the problem above
Video duration:
1m
Play a video:
0 Comments
Key Concepts
Here are the essential concepts you must grasp in order to answer the question correctly.
Function Transformation
Function transformation refers to the process of altering the graph of a function through operations such as scaling, translating, or reflecting. In this case, the function g(x) = ½ f(x) represents a vertical compression of the function f(x) by a factor of ½, meaning that all y-values of f(x) are halved, resulting in a graph that is closer to the x-axis.
Graphing linear functions involves plotting points that satisfy the function's equation and connecting them to form a straight line. For the function f(x) shown in the graph, which is a horizontal line at y = -3 between x = 1 and x = 4, understanding how to plot these points is essential for accurately representing the transformed function g(x).
Horizontal and vertical scaling are techniques used to stretch or compress the graph of a function. Vertical scaling, as seen in g(x) = ½ f(x), compresses the graph vertically, affecting the y-values while keeping the x-values unchanged. This concept is crucial for predicting how the graph of g will appear compared to f.

 Verified step by step guidance
 4:22
4:22