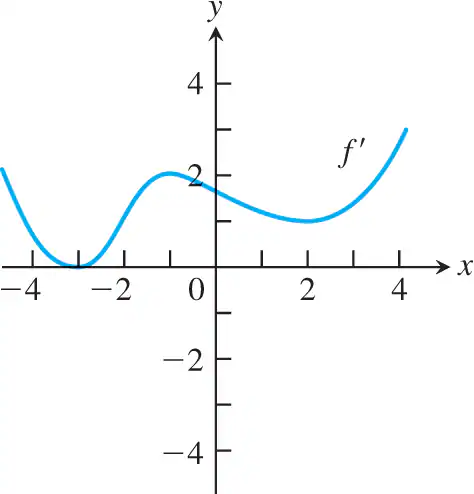
Ch. 4 - Applications of Derivatives
Hass - Thomas' Calculus 15th Edition
Hass15th EditionThomas' CalculusISBN: 9780137616077Not the one you use?Change textbook
Chapter 4, Problem 4.4.99

99. In Exercises 99 and 100, the graph of f' is given. Determine x-values corresponding to inflection points for the graph of f.
Graph of f' showing a curve with inflection points, plotted on a Cartesian coordinate system with labeled axes.

Verified step by step guidance
1
Step 1: Recall that inflection points occur where the second derivative of a function changes sign. This means we need to analyze the graph of f' to determine where the slope of f' (which represents f'') changes from positive to negative or vice versa.
Step 2: Observe the graph of f'. The slope of f' changes sign at points where the graph of f' transitions from increasing to decreasing or decreasing to increasing. These are the x-values where the graph of f' has local maxima or minima.
Step 3: Identify the x-values of local maxima and minima on the graph of f'. From the graph, it appears that there are local maxima at x ≈ -2 and local minima at x ≈ 2.
Step 4: Verify that these points correspond to changes in the sign of the slope of f'. At x ≈ -2, the slope of f' changes from positive to negative, and at x ≈ 2, the slope of f' changes from negative to positive.
Step 5: Conclude that the x-values corresponding to inflection points for the graph of f are approximately x = -2 and x = 2.

Verified video answer for a similar problem:

This video solution was recommended by our tutors as helpful for the problem above.
Video duration:
2m
Was this helpful?

Key Concepts

Here are the essential concepts you must grasp in order to answer the question correctly.

Derivative and Its Graph

The derivative of a function, denoted as f', represents the rate of change of the function f. The graph of f' provides insights into the behavior of f, such as where it is increasing or decreasing. Points where f' changes from positive to negative indicate local maxima, while points where it changes from negative to positive indicate local minima.
Recommended video:
06:15
Graphing The Derivative

Inflection Points

Inflection points occur where the concavity of a function changes, which can be identified by analyzing the second derivative, f''. However, when given the graph of f', inflection points correspond to where f' changes its increasing or decreasing behavior. This means that the x-values where f' has local extrema (maxima or minima) are potential inflection points for f.
Recommended video:
04:50
Critical Points

Critical Points

Critical points are values of x where the derivative f' is either zero or undefined. These points are significant because they can indicate local maxima, minima, or inflection points. In the context of the given graph, identifying the x-values where f' equals zero helps in determining where the function f may have changes in concavity, leading to inflection points.
Recommended video:
04:50
Critical Points