Textbook Question
Economics
Marginal cost Suppose that the dollar cost of producing x washing machines is c(x) = 2000 + 100x − 0.1x².
a. Find the average cost per machine of producing the first 100 washing machines.
1
views
 Verified step by step guidance
 06:29
06:29 06:15
06:15 04:50
04:50Economics
Marginal cost Suppose that the dollar cost of producing x washing machines is c(x) = 2000 + 100x − 0.1x².
a. Find the average cost per machine of producing the first 100 washing machines.
Economics
Marginal cost Suppose that the dollar cost of producing x washing machines is c(x) = 2000 + 100x − 0.1x².
c. Show that the marginal cost when 100 washing machines are produced is approximately the cost of producing one more washing machine after the first 100 have been made, by calculating the latter cost directly.
Understanding Motion from Graphs
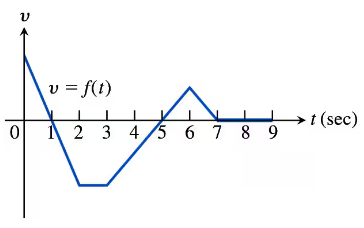
The accompanying figure shows the velocity v = f(t) of a particle moving on a horizontal coordinate line.
a. When does the particle move forward? Move backward? Speed up? Slow down?
Understanding Motion from Graphs
The accompanying figure shows the velocity v = f(t) of a particle moving on a horizontal coordinate line.
c. When does the particle move at its greatest speed?
In Exercises 19–22, find the values of the derivatives.
dr/dθ |θ₌₀ if r = 2/√(4 – θ)
Understanding Motion from Graphs
The accompanying figure shows the velocity v = f(t) of a particle moving on a horizontal coordinate line.
b. When is the particle’s acceleration positive? Negative? Zero?