Textbook Question
Use graphing software to graph the functions specified in Exercises 31–36.
Select a viewing window that reveals the key features of the function.
Graph the upper branch of the hyperbola y² − 16x² = 1.
 Verified step by step guidance
 5:53
5:53 07:17
07:17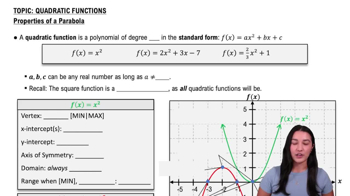 7:42
7:42Use graphing software to graph the functions specified in Exercises 31–36.
Select a viewing window that reveals the key features of the function.
Graph the upper branch of the hyperbola y² − 16x² = 1.
In Exercises 35 and 36, find the (a) domain and (b) range.
𝔂 = { -x - 2, -2 ≤ x ≤ - 1
{ x, -1 < x ≤ 1
{ -x + 2, 1 < x ≤ 2
Theory and Examples
In Exercises 69 and 70, match each equation with its graph. Do not use a graphing device, and give reasons for your answer.
a. y = x⁴
b. y = x⁷
c. y = x¹⁰
<IMAGE>
[Technology Exercise]
You want to make an 80° angle by marking an arc on the perimeter of a 12-in.-diameter disk and drawing lines from the ends of the arc to the disk’s center. To the nearest tenth of an inch, how long should the arc be?
Increasing and Decreasing Functions
Graph the functions in Exercises 37–46. What symmetries, if any, do the graphs have? Specify the intervals over which the function is increasing and the intervals where it is decreasing.
y = x³/8
In Exercises 9–16, determine whether the function is even, odd, or neither.
𝔂 = x² + 1