Ch. 5 - Integration
Briggs - Calculus: Early Transcendentals 3rd Edition
Briggs3rd EditionCalculus: Early TranscendentalsISBN: 9780136847243Not the one you use?Change textbook
Chapter 5, Problem 5.2.63

Definite integrals from graphs The figure shows the areas of regions bounded by the graph of Ζ’ and the 𝓍-axis. Evaluate the following integrals.


βˆ«β‚€αΆœ |Ζ’(𝓍)| d𝓍

Verified step by step guidance
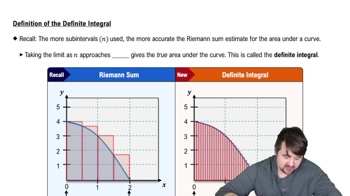
1
Identify the interval from 0 to c on the x-axis and observe the graph of the function Ζ’(𝓍) over this interval.
Since the integral is of the absolute value |Ζ’(𝓍)|, note that all areas between the graph and the x-axis will be considered positive, regardless of whether Ζ’(𝓍) is above or below the x-axis.
Break the interval [0, c] into subintervals where the function Ζ’(𝓍) does not change sign (i.e., where it is either entirely positive or entirely negative).
For each subinterval, calculate the area between the graph of Ζ’(𝓍) and the x-axis. If the function is negative on that subinterval, take the absolute value of the integral (which corresponds to the area).
Sum all these positive areas from each subinterval to find the value of the definite integral βˆ«β‚€αΆœ |Ζ’(𝓍)| d𝓍.

Verified video answer for a similar problem:

This video solution was recommended by our tutors as helpful for the problem above.
Video duration:
3m
Was this helpful?

Key Concepts

Here are the essential concepts you must grasp in order to answer the question correctly.

Definite Integral

A definite integral calculates the net area under a curve between two points on the x-axis. It sums the values of the function over the interval, considering areas above the x-axis as positive and below as negative. This concept is fundamental for interpreting integrals from graphs.
Recommended video:
05:43
Definition of the Definite Integral

Absolute Value of a Function in Integration

Integrating the absolute value of a function means summing all areas as positive, regardless of whether the function is above or below the x-axis. This ensures the integral represents total area without cancellation from negative parts, which is crucial when evaluating βˆ«β‚€αΆœ |Ζ’(x)| dx.
Recommended video:
06:37
Average Value of a Function

Area Interpretation from Graphs

When given a graph, the definite integral corresponds to the area between the curve and the x-axis. Understanding how to read and calculate these areas, especially when the function crosses the axis, helps in evaluating integrals accurately, including those involving absolute values.
Recommended video:
06:15
Graphing The Derivative
Related Practice
Textbook Question

Definite integrals from graphs The figure shows the areas of regions bounded by the graph of Ζ’ and the 𝓍-axis. Evaluate the following integrals.


βˆ«β‚€α΅ƒ Ζ’(𝓍) d𝓍

Textbook Question

Why can the constant of integration be omitted from the antiderivative when evaluating a definite integral?

Textbook Question

Integrals with sinΒ² 𝓍 and cosΒ² 𝓍 Evaluate the following integrals.                                                                                                             


 βˆ« 𝓍 cos²𝓍² d𝓍

Textbook Question

Definite integrals Use a change of variables or Table 5.6 to evaluate the following definite integrals.                                                                                                                         


 βˆ«β‚‹β‚ΒΉ (𝓍―1) (𝓍²―2𝓍)⁷ d𝓍

Textbook Question

Symmetry of composite functions Prove that the integrand is either even or odd. Then give the value of the integral or show how it can be simplified. Assume f and g are even functions and p and q are odd functions.


βˆ«α΅ƒβ‚‹β‚ Ζ’(g(𝓍)) d𝓍

Textbook Question

The linear function Ζ’(𝓍) = 3 ― 𝓍 is decreasing on the interval [0, 3]. Is its area function for Ζ’ (with left endpoint 0) increasing or decreasing on the interval [0, 3]? Draw a picture and explain.