Textbook Question
Consider the lim_x→∞ (√ ax + b) / √cx + d where a, b, c, and d are positive real numbers. Show that l’Hôpital’s Rule fails for this limit. Find the limit using another method.

 Verified step by step guidance
 04:50
04:50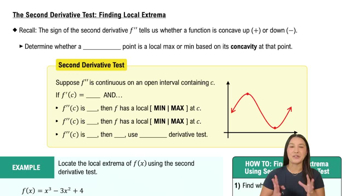 06:02
06:02 01:47
01:47Consider the lim_x→∞ (√ ax + b) / √cx + d where a, b, c, and d are positive real numbers. Show that l’Hôpital’s Rule fails for this limit. Find the limit using another method.
{Use of Tech} Graph carefully Graph the function f(x) = 60x⁵ - 901x³ + 27x in the window [-4,4] x [-10,000, 10,000]. How many extreme values do you see? Locate all the extreme values by analyzing f'.
Interpreting the derivative The graph of f' on the interval [-3,2] is shown in the figure. <IMAGE>
a. On what interval(s) is f increasing? Decreasing?
Prove that lim_x→∞ (1 + a/x)ˣ = eᵃ , for a ≠ 0 .
Use limit methods to determine which of the two given functions grows faster, or state that they have comparable growth rates.
x²⁰ ; 1.0001ˣ
Concavity of parabolas Consider the general parabola described by the function f(x) = ax² + bx + c. For what values of a, b, and c is f concave up? For what values of a, b, and c is f concave down?