Skip to main content
Statistics for Business
My Course
Learn
Exam Prep
AI Tutor
Study Guides
Flashcards
Explore
Try the app
My Course
Learn
Exam Prep
AI Tutor
Study Guides
Flashcards
Explore
Try the app
Back
Interpreting Standard Deviation definitions
You can tap to flip the card.
Standard Deviation
You can tap to flip the card.
👆
Standard Deviation
A measure indicating how much values in a dataset differ from the mean, reflecting the spread or variability of the data.
Track progress
Control buttons has been changed to "navigation" mode.
1/13
Related flashcards
Related practice
Recommended videos
Interpreting Standard Deviation quiz
Interpreting Standard Deviation
15 Terms
Interpreting Standard Deviation
3. Describing Data Numerically
8 problems
Topic
Ernest
Percentiles & Quartiles
3. Describing Data Numerically
10 problems
Topic
Jonathan
3. Describing Data Numerically
8 topics
18 problems
Chapter
Jonathan
Guided course
05:42
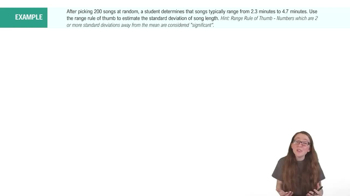
Empirical Rule of Standard Deviation and Range Rule of Thumb Example 1
1
views
Guided course
01:56
Empirical Rule of Standard Deviation and Range Rule of Thumb Example 2
2
views
Guided course
07:10
Empirical Rule of Standard Deviation and Range Rule of Thumb
1
views
Terms in this set (13)
Hide definitions
Standard Deviation
A measure indicating how much values in a dataset differ from the mean, reflecting the spread or variability of the data.
Mean
The arithmetic average of a dataset, serving as a central value around which deviations are measured.
Variance
The average of squared differences from the mean, providing the foundation for calculating standard deviation.
Normal Distribution
A bell-shaped curve where most data points cluster around the mean, with spread determined by standard deviation.
Data Spread
The extent to which values in a dataset are dispersed, often summarized by measures like standard deviation.
Outlier
A data point significantly distant from other observations, often impacting measures of spread.
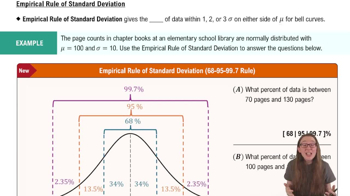
Empirical Rule
A guideline stating that about 68%, 95%, and 99.7% of data fall within one, two, and three standard deviations from the mean in a normal distribution.
Z-Score
A value expressing how many standard deviations a data point is from the mean, aiding in comparison across datasets.
Skewness
A measure of asymmetry in a distribution, affecting how standard deviation describes data spread.
Population
The entire group of individuals or items under study, from which data may be collected.
Sample
A subset of a population, used to estimate characteristics like standard deviation for the whole group.
Dispersion
A general term for the degree to which data values are spread out, with standard deviation as a key measure.
Bell Curve
A graphical representation of a normal distribution, where standard deviation determines the width of the curve.
 BackBack

 05:42
05:42