Skip to main content
Statistics for Business
My Course
Learn
Exam Prep
AI Tutor
Study Guides
Flashcards
Explore
Try the app
My Course
Learn
Exam Prep
AI Tutor
Study Guides
Flashcards
Explore
Try the app
Back
Correlation Coefficient quiz
You can tap to flip the card.
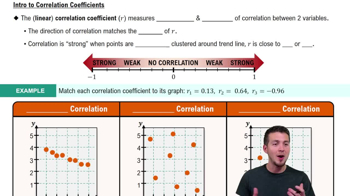
What does the correlation coefficient (r) measure between two variables?
You can tap to flip the card.
👆
What does the correlation coefficient (r) measure between two variables?
It measures the strength and direction of the linear relationship between two variables.
Track progress
Control buttons has been changed to "navigation" mode.
1/15
Related flashcards
Related practice
Recommended videos
Correlation Coefficient definitions
Correlation Coefficient
15 Terms
Correlation Coefficient
11. Correlation
10 problems
Topic
Ally
11. Correlation
2 topics
15 problems
Chapter
David-Paige
Guided course
03:44
Calculating Correlation Coefficient - Graphing Calculator Example 1
2
views
Guided course
05:43
Correlation Coefficient
2
views
Guided course
04:40
Calculating Correlation Coefficient - Graphing Calculator
2
views
Terms in this set (15)
Hide definitions
What does the correlation coefficient (r) measure between two variables?
It measures the strength and direction of the linear relationship between two variables.
What is the range of possible values for the correlation coefficient r?
The correlation coefficient r ranges from -1 to 1.
What does a positive value of r indicate about the relationship between two variables?
A positive r indicates a positive correlation, meaning as one variable increases, the other also increases.
What does a negative value of r indicate about the relationship between two variables?
A negative r indicates a negative correlation, meaning as one variable increases, the other decreases.
What does an r value close to zero signify about the correlation between two variables?
An r value close to zero signifies weak or no correlation between the variables.
How can you visually identify strong correlation in a scatterplot?
Strong correlation is seen when data points are tightly clustered around a trend line.
What r value is generally considered to indicate a strong correlation?
Generally, r values beyond 0.8 or -0.8 are considered strong correlations.
Does the slope of the best fit line affect the value of r?
No, the slope does not affect r; r depends on how tightly the data points cluster around the line.
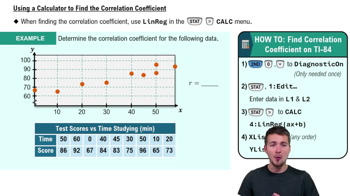
What is the first step when using a TI-84 calculator to find the correlation coefficient?
The first step is to turn on 'diagnostic on' in the calculator's catalog menu.
Which lists do you use for x and y values when entering data into a TI-84 calculator?
You use L1 for x values and L2 for y values.
Which calculator function do you use to calculate the correlation coefficient on a TI-84?
You use the 'linreg(ax+b)' function in the calculator's stats menu.
Where is the r value displayed in the calculator's output after running linreg(ax+b)?
The r value is displayed at the very bottom of the calculator's readout.
What does an r value of 0.94 indicate about the data's correlation?
It indicates a strong, positive linear correlation between the variables.
What is the difference between r and r squared in the calculator's output?
r is the correlation coefficient, while r squared is the coefficient of determination; for correlation, use r.
What should you do if your data points are not tightly clustered around a trend line?
Expect a lower r value, indicating weak or no correlation.
 BackBack

 03:44
03:44