Back
BackConfidence Intervals for Population Variance definitions
You can tap to flip the card.
Control buttons has been changed to "navigation" mode.
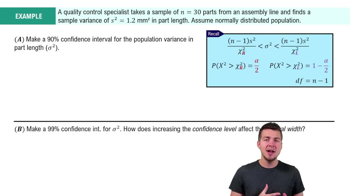
1/15Confidence Intervals for Population Variance
8. Sampling Distributions & Confidence Intervals: Proportion
Topic
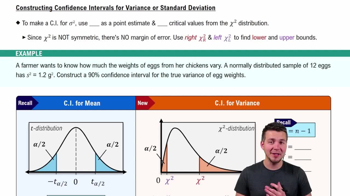
Chi Square Distribution
8. Sampling Distributions & Confidence Intervals: Proportion
Topic
8. Sampling Distributions & Confidence Intervals: Proportion - Part 1 of 2
2 topics 15 problems
Chapter

Laura
8. Sampling Distributions & Confidence Intervals: Proportion - Part 2 of 2
2 topics
Chapter
 06:05
06:05