Skip to main content
Statistics for Business
My Course
Learn
Exam Prep
AI Tutor
Study Guides
Flashcards
Explore
Try the app
My Course
Learn
Exam Prep
AI Tutor
Study Guides
Flashcards
Explore
Try the app
Back
5-Number Summary Using a TI-84 definitions
You can tap to flip the card.
Five-Number Summary
You can tap to flip the card.
👆
Five-Number Summary
A set of values summarizing a dataset, including minimum, first quartile, median, third quartile, and maximum.
Track progress
Control buttons has been changed to "navigation" mode.
1/15
Related flashcards
Related practice
Recommended videos
5-Number Summary Using a TI-84 quiz
5-Number Summary Using a TI-84
15 Terms
5-Number Summary Using a TI-84
3. Describing Data Numerically
10 problems
Topic
Boxplots
3. Describing Data Numerically
4 problems
Topic
Ernest
3. Describing Data Numerically
8 topics
18 problems
Chapter
Jonathan
Guided course
04:51
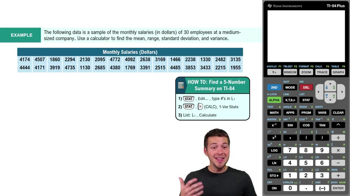
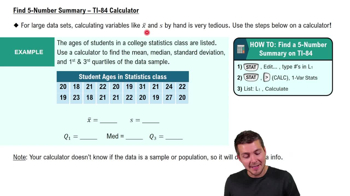
Find 5-Number Summary - TI-84 Calculator
1
views
Guided course
05:45
Find 5-Number Summary - TI-84 Calculator Example 1
Terms in this set (15)
Hide definitions
Five-Number Summary
A set of values summarizing a dataset, including minimum, first quartile, median, third quartile, and maximum.
TI-84 Calculator
A graphing device used to input data and quickly compute statistical measures for large datasets.
Mean
The average value of a dataset, calculated by summing all entries and dividing by the number of data points.
Median
The middle value in an ordered dataset, dividing the data into two equal halves.
Standard Deviation
A measure indicating how much data values deviate from the mean, reflecting dataset variability.
First Quartile
The value below which 25% of the data falls, marking the lower quarter of the dataset.
Third Quartile
The value below which 75% of the data falls, marking the upper quarter of the dataset.
One-Variable Statistics
A calculator function that outputs key statistical measures from a single list of data.
Sample
A subset of a population, used to estimate characteristics of the whole group.
Population
The entire group from which data can be collected or analyzed.
SX
The symbol representing sample standard deviation on the TI-84, used for sample data analysis.
Sigma X
The symbol representing population standard deviation on the TI-84, used for population data analysis.
Minimum
The smallest value in a dataset, indicating the lower boundary of the data range.
Maximum
The largest value in a dataset, indicating the upper boundary of the data range.
Data List
An organized sequence of values entered into the calculator for statistical analysis.
 BackBack

 04:51
04:51