- Download the worksheet to save time writing
- Start solving the practice problems
- If you're stuck, watch the video solutions
- See your summary to get more insights

A contingency table shows the number of adults (in units of thousands) in a city by employment status and level of education:
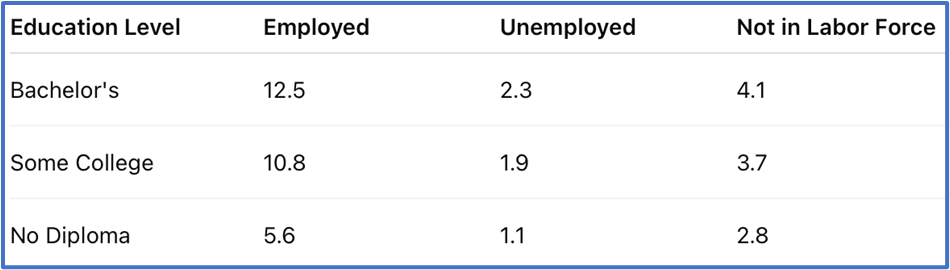
What percentage of adults (i) are employed and have some college, (ii) are unemployed, and (iii) have no diploma?
A safety agency studied how experience affects drivers’ ability to correctly identify traffic signs during a simulation. Two groups, licensed drivers and learner drivers, were shown standard road signs under timed conditions and were asked to identify them. The table below shows whether their responses were correct or incorrect.
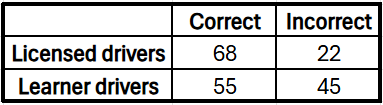
At a significance level, test the claim that correct identification is independent of the driver’s experience level.
A university has two departments, and . The following admission numbers are observed:
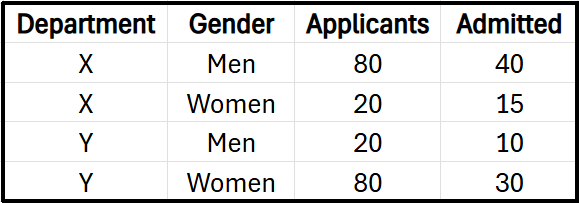
Explain why the apparent gender disadvantage disappears when conditioning on department type.